I wanted to write this post because a lot of people see big Amazon sales numbers and assume that tells the whole story. It does not.
You can have strong revenue, plenty of orders, and still not have a clear picture of what your business is actually earning after fees, refunds, inventory costs, prep expenses, software, and payroll.
That is why Sellerboard has become such an important part of my business.
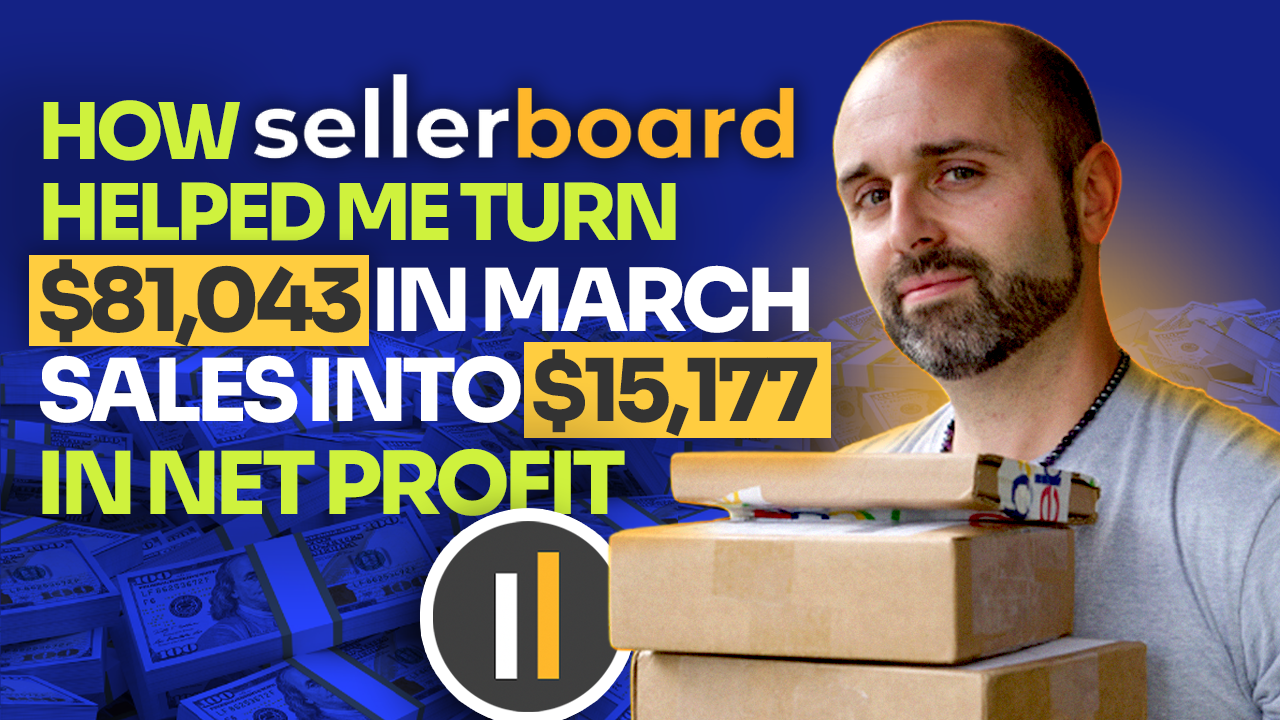
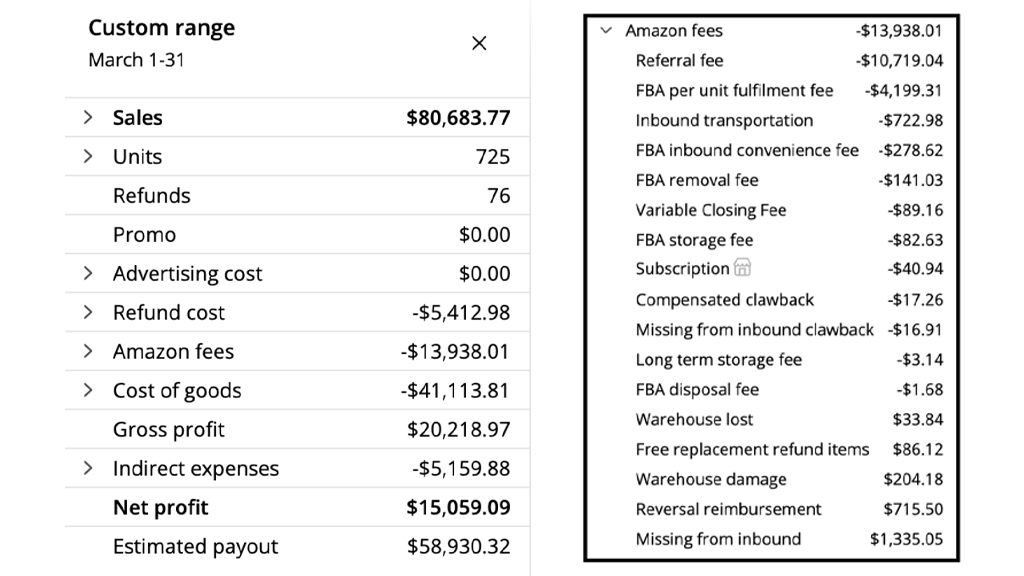
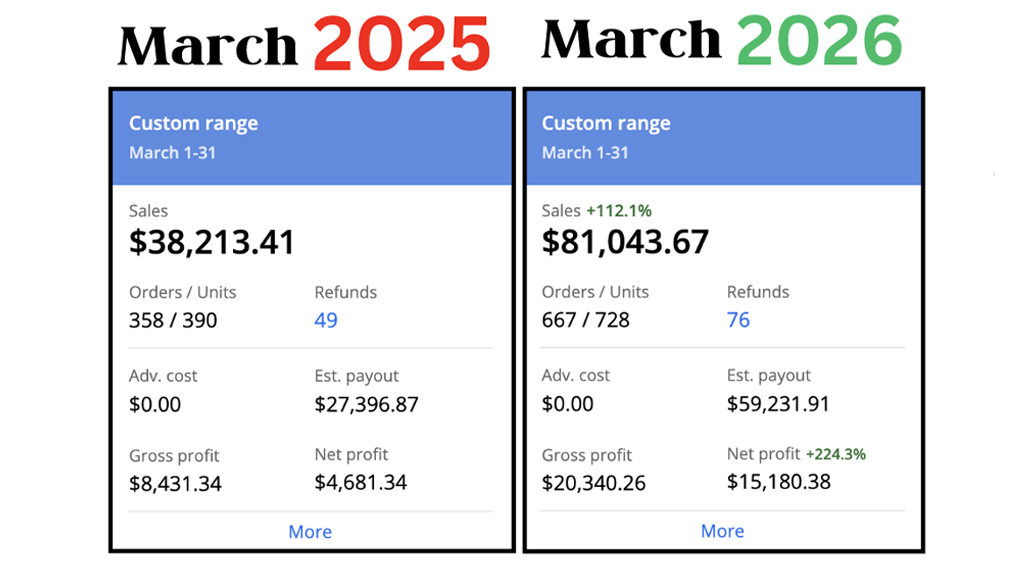
In March 2026, I did $81,043.67 in sales, sold 667 orders, and moved 728 total units.
After everything was accounted for, my net profit came to $15,177.83.
That was a phenomenal month, but the real value was not just the number itself. The real value was being able to see exactly how I got there.
In this post, I want to break down the March numbers, show how Sellerboard helps me understand the true health of my business and explain why using its data has helped me improve my margins compared to last year.
This is especially important in my eBay to Amazon business, where the best opportunities are not always the ones that look best at first glance.
Watch Video Below
(Click Here to Watch on YouTube)
How Sellerboard Gives Me a True Profit Picture Beyond Total Sales
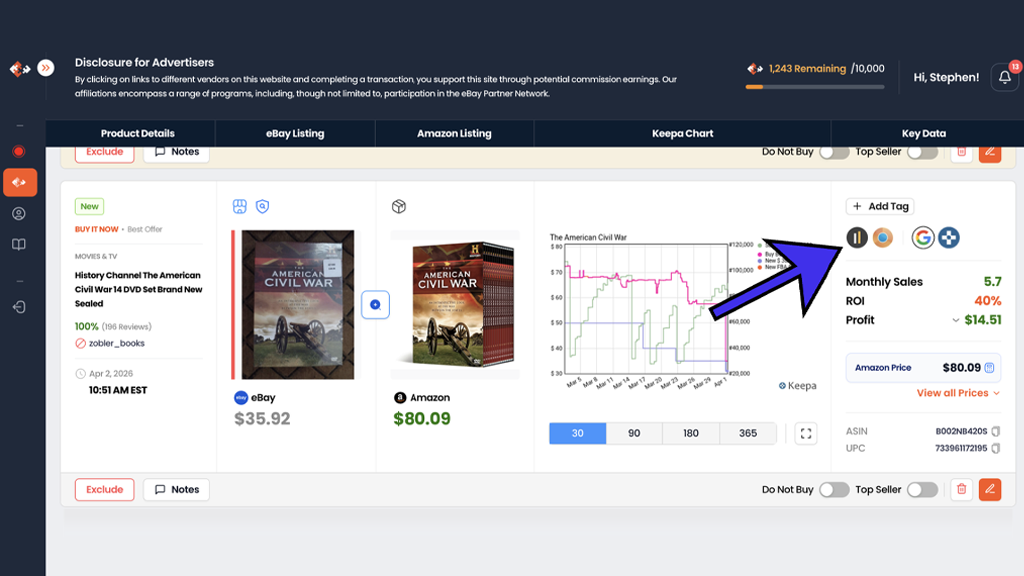
My business model is simple. I buy products on eBay and flip them on Amazon.
I source those products with Replen Catcher, which helps me monitor products on eBay and identify listings that may be profitable to resell on Amazon.
But finding products is only one part of the equation.
What really matters is knowing whether those products are still profitable after Amazon fees, returns, prep costs, and everything else that comes with running the business.
That is where Sellerboard comes in.
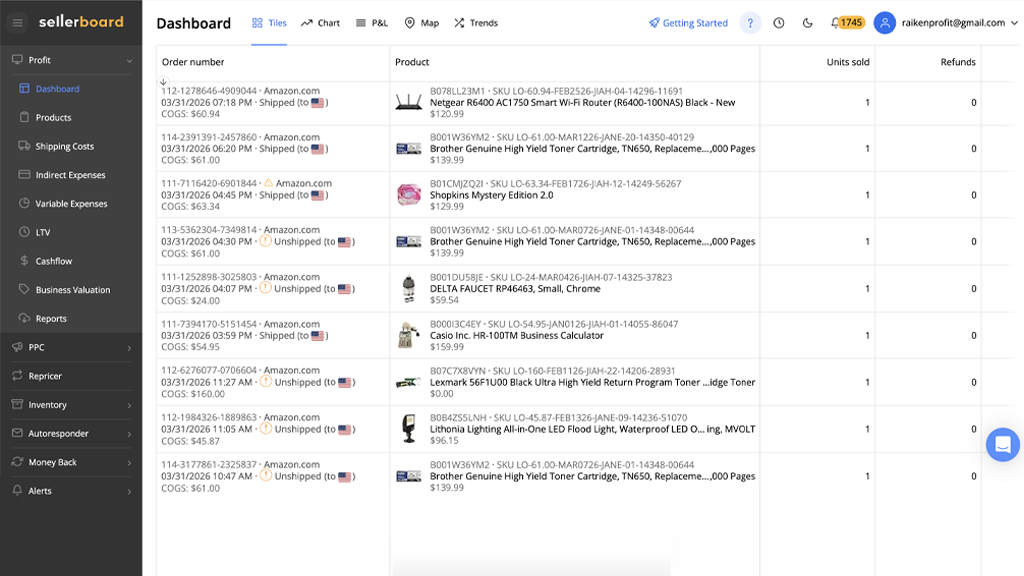
One of the things I like most about Sellerboard is that right on the main dashboard, I can quickly see my total sales, orders, units sold, returns, gross profit, and net profit.
For March 2026, that meant seeing the full picture in one place instead of relying on revenue alone.
Without that level of visibility, it is very easy to fool yourself.
You can look at a big sales number and think you are crushing it, while missing what is really happening underneath.
Sellerboard helps me avoid that by showing me what the business actually earned after the important costs are included.
The Sellerboard Breakdown That Shows Where the Money Really Goes
The real power of Sellerboard shows up when you dig deeper into the reporting.
Inside the dashboard, I can click into the more detailed breakdown and see exactly how the month came together.
That includes sales, units sold, refunds, Amazon fees, cost of goods, and indirect expenses. Instead of wondering where the money went, I can see it clearly.
For March, I had $81,043.67 in sales, but I also had $13,998 in Amazon fees.
That included more than $4,000 in FBA fulfillment fees, plus inbound placement costs, removal fees, closing fees, storage fees, and my monthly subscription fee.
Amazon has a lot of charges that can eat into margins fast, especially if you are only looking at top-line sales.
Sellerboard makes those fees visible in a way that is easy to understand.
That matters because when you are selling through FBA, the difference between a healthy business and a weak one often comes down to details like fulfillment costs, storage, and refund impact.
This is one of the biggest reasons I value Sellerboard so much.
It gives me a clear way to understand how revenue turns into actual profit.
Why Sellerboard Return Data Matters More Than Most Sellers Realize
Returns are one of the biggest factors in my business, and Sellerboard helps me see them much more clearly.
Out of the 728 units I sold in March, I had 76 returns. My overall refund rate was 10.44%.
That alone is something every Amazon seller should be watching closely, because refund rates can quietly destroy profit if you are not paying attention.
Sellerboard also helps me go one level deeper. It shows what portion of returned inventory is sellable and what portion is unsellable.
In my business, a lot of the items I sell are brand new, and many Amazon customers open them, use them, or damage the packaging. When those items go back to Amazon, some can be relisted and some cannot.
For March, about 30% of my returned items were sellable, so that value could be added back into my inventory.
That matters because it changes how I think about the real cost of returns.
If I only looked at the refund total and did not understand how much inventory was recoverable, I would be missing part of the picture.
Sellerboard helps me keep that context in view, which leads to better sourcing and better expectations around certain products and ASINs.
How SellerboardHelps Me Track Cost of Goods and Net Margin Accurately
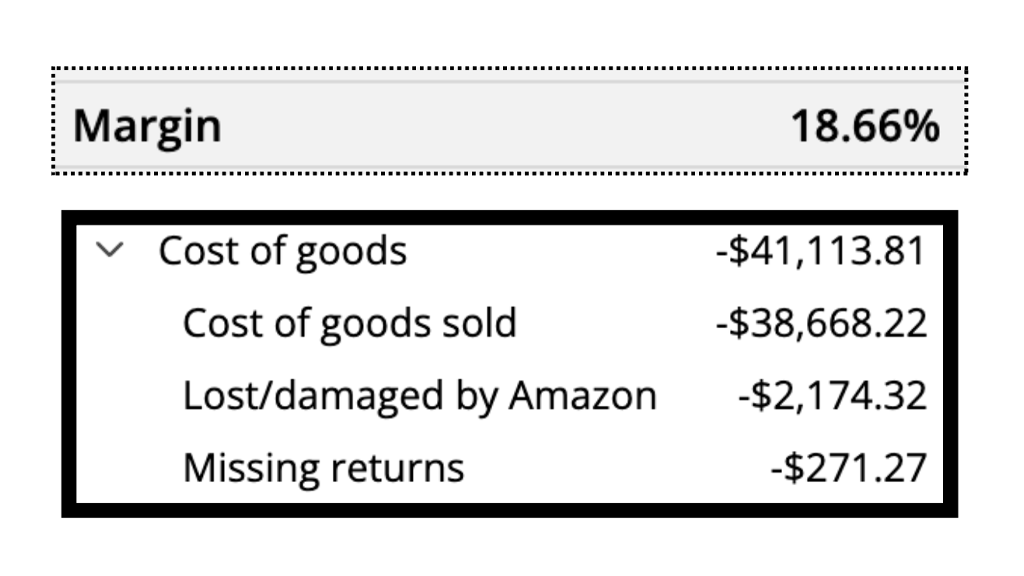
Another feature I rely on is Sellerboard’s cost of goods tracking.
For March, the cost of goods tied to the items I sold came to $38,848 before adjustments.
Once lost and damaged items and missing returns were factored in, the total came out higher.
This is important because Sellerboard is not just showing me what I spent in a month.
It is showing me the cost tied to the inventory that actually sold during that time period.
That distinction matters a lot. Cash flow and profitability are not the same thing.
If you want an accurate read on net profit and net margin, you need your cost of goods entered correctly.
In my case, my team updates buy costs as items are listed.
Because we put the buy cost into our custom SKU, we are able to keep Sellerboard updated and get a much more accurate measurement of profitability.
If that data is missing, then your net margin and net profit numbers are not going to tell the truth.
That is one more reason Sellerboard has become such an important operating tool for my team.
It is not just a dashboard. It helps us build a more accurate system for understanding the business.
The Sellerboard Features I Use to Track Indirect Expenses and Real Net Profit
Gross profit is helpful, but net profit is what I care about most. Sellerboard helps me bridge that gap by letting me account for indirect expenses.
In my business, that includes bookkeeping and accounting, prep center costs, software, and my virtual assistant expenses.
My prep center alone can vary quite a bit depending on how much volume I am sending in. Sometimes it is closer to $1,000 and other times it goes above $2,000.
Sellerboard lets me enter and adjust these expenses so I can get much closer to my true net profit.
For March, after all of those indirect expenses were factored in, my net profit came to $15,177.83.
My net margin came to 18.73%, and my overall net ROI came in around 37%.
That is the kind of number that really matters. A business is not strong because of sales alone.
It is strong because it can hold profit after fees, returns, labor, and infrastructure costs.
Sellerboard helps me measure that instead of guessing.
What Changed From March 2025 to March 2026 With Sellerboard
When I compared March 2026 to March 2025, the difference was huge.
In March 2025, my sales were around $38,000. My refund rate was higher at around 12%.
My margin was around 12%, and my total profit was $4,681.
In March 2026, sales jumped to more than $81,000, the refund rate improved, my margin climbed to nearly 19%, and net profit increased to more than $15,000.
That kind of improvement did not happen by accident. A big part of it came from improving my systems, and Sellerboard played a major role in that.
The biggest shift was using Sellerboard data to make better buying decisions.
Instead of only looking at what an item might sell for, I started paying closer attention to what certain ASINs actually produced over time after refunds, fees, and margin pressure were factored in.
That change helped me stop repeating mistakes on products that looked good on the surface but were weaker once the full data came in.
How I Use Sellerboard With Replen Catcherto Make Better Buying Decisions
This was probably the most important change I made.
When sourcing in Replen Catcher, I can use Sellerboard to analyze a specific ASIN before I buy more of it.
That helps me move beyond a simple buy low, sell high calculation.
I can look at how that ASIN has performed in my business over time.
For example, I can see how many times I have sold it, whether I have had refunds, what my profit looked like, what my net margin was, and what my ROI came out to after the full business impact was included.
I can also look back at order-level data and see what I paid for the item in prior purchases.
That context is incredibly valuable.
There were products I bought repeatedly in 2025 because they were selling, but once I looked closer, some of them were not that profitable after price drops, refund rates, shipping costs, or category-specific costs hit the margins.
Some were dangerous goods. Some were large and bulky. Some just did not hold enough profit once everything was accounted for.
Using Sellerboard this way helps me identify which ASINs are truly worth scaling and which ones only look good at first glance.
That has made my sourcing smarter and my business stronger over the long haul.
Why Sellerboard Has Become a Daily Tool for Me and My Team

At this point, Sellerboard is not something I check once in a while. It is part of how my business runs.
My team and I use it every day to monitor profitability, review expenses, understand returns, and make more informed sourcing decisions.
It has helped us spend more confidently, source more efficiently, reduce our refund rate, and improve our net margin.
What I appreciate most is that Sellerboard keeps me honest. It does not let me hide behind revenue numbers.
It shows me the actual business underneath the sales, and that makes it easier to improve the right things.
March 2026 was a strong month, but the bigger takeaway is not just that I made over $15,000 in net profit.
It is that Sellerboard helped me understand why that happened and how to make better decisions going forward.
Conclusion
If you are selling on Amazon and care about real profit, Sellerboard is one of the most valuable tools you can add to your business.
It helps you get past surface-level sales numbers and understand what is really happening with your fees, returns, cost of goods, indirect expenses, ASIN performance, and true net profit.
For me, that visibility has made a big difference.
It has helped me make better sourcing decisions, avoid buying products that look good on the surface but do not hold up after returns and fees, and build a business with stronger margins over time.
That is why I wanted to share this breakdown.
The $81,043 in sales was a strong headline number, but Sellerboard is what helped me understand how that turned into $15,177 in net profit and what I need to keep improving.
If you want to see this level of detail in your own business, try Sellerboard for yourself.
You can get a free 60-day trial with no credit card required, which makes it easy to test it out and see how much clarity it can bring to your numbers.

Hey, I’m Steve
I'm just an average guy who reached a point in life where I grew weary of the corporate grind and decided to forge my own path.

Welcome to my website where I share my journey as an entrepreneur and offer support to those who aspire to start their own businesses and transform their lives, just like I did.
I understand the challenges and frustrations that come with breaking away from the traditional nine-to-five routine. That's why I created this platform – to provide inspiration, guidance, and practical tips to help you navigate the exciting world of entrepreneurship.


360 Bloomfield Ave, Suite 301,
Windsor, CT, 06095, United States
© Copyright 2026 | All Rights Reserved