What’s up, Amazon Enthusiasts!
Steve here from Raiken Profit, coming at you with another gem of a guide!
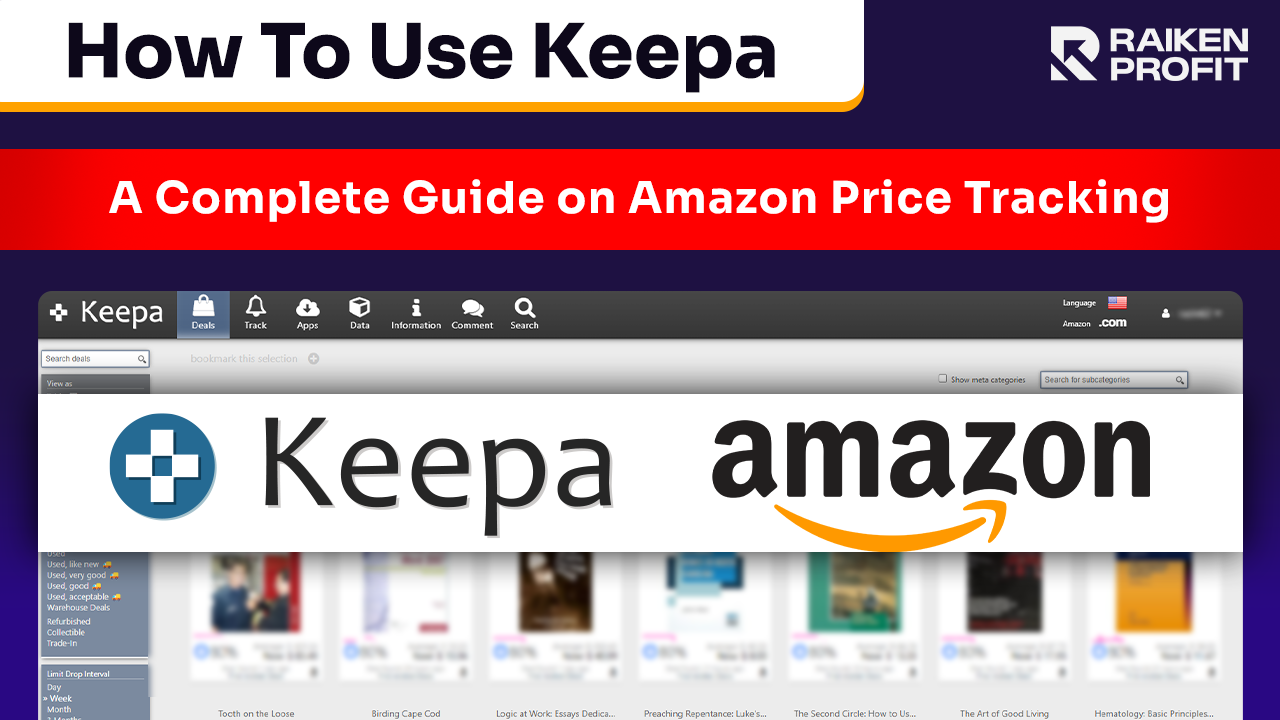
Today, we're diving into the world of Amazon price tracking with Keepa.
I've been using this tool to skyrocket my Amazon business, and let me tell you, it's a game-changer.
Are you an Amazon seller looking for ways to increase your business?
Do you wish to understand how pricing, product rankings, and historical data can help make informed selling decisions?
As far as the Amazon marketplace is concerned, there’s no better tool than Keepa to get you through the Amazon market dynamics.
In this comprehensive guide on how to use Keepa, I will delve into its functionalities and advantages, as well as what makes it a must-have tool for every seller.
What is Keepa?
Keepa, often referred to as an essential tool in any Amazon Seller tutorial, is an indispensable Amazon extension.
With a simple click, it gives you in-depth information about the price of any product over time, its Sales Rank, and many other important metrics.
This information is essential in identifying the demand and price of a given item.
For instance, if your item is a gadget that you are planning to sell and Keepa’s graph reveals how its price has declined significantly over time, maybe it would be better for you not to proceed or change the way in which it will be listed.
However, Keepa does more than just offer data; it helps you boost your ranking on Amazon.
Using its “buy box” function, you can make yourself the default option when customers press the “Add to Cart” button.
The buy box is highly sought after due to the fact that it increases sales and your products get more visibility.
Keepa allows you to track and analyze who currently holds the buy box for a particular item, allowing you to plan strategically and optimize your listings in order to compete with them.
Watch the video below:
(Click here to watch on YouTube)
Keepa Charts
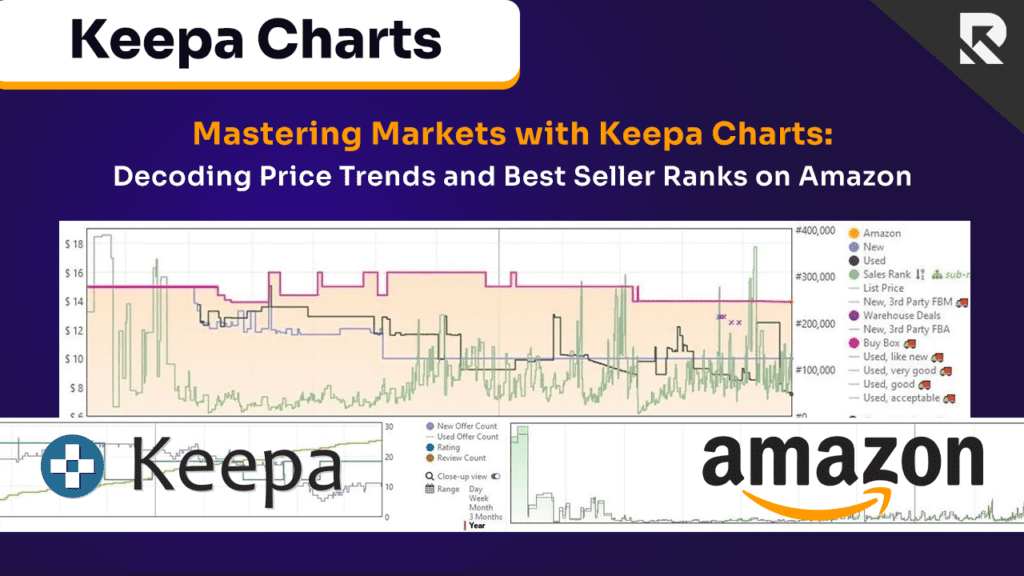
A good thing about Keepa is its user-friendly Keepa Chart system.
The charts provide a visual representation of a product's price history, making it easy for sellers to understand how prices have changed over a specific period.
By simply glancing at the chart, you can quickly see if there have been any significant price drops or increases.
This knowledge is essential for spotting deals and knowing when to buy or sell a particular item.
Keepa shows three charts for each Amazon product.
Let’s call them the Top Chart, the Middle Chart, and the Bottom Chart.
We’ll look at each one briefly below.
The Top Chart: Best Seller Rank History & Price History
This chart carries the most amount of information of the three charts. Some of its features are explained below.
Orange Shaded Area: This shows that Amazon stocks this product. The top edge of the shaded area represents the Amazon selling price represented by a yellow line (not shown in the chart below). Gaps in the shaded area represent periods when Amazon is out of stock.
Pink Line: This is the Buy Box price. If it appears at the top of the shaded area, then this means that Amazon has most likely had the Buy Box throughout.
Blue Line: This is how much third-party sellers sell this product for if it is New.
Black Line: This is how much third-party sellers sell this product for if it is Used.
Green Line: This is the Sales Rank/Best Sales Rank (BSR) for a product. Lots of movement in the green line indicates that the product sells well. Typically, a lower BSR score means you’re earning lots of sales, and a higher BSR means you’re earning fewer sales. So, for example, a BSR of 3 means that it’s the third best-selling product in that category. Understanding the Sales Rank Chart Amazon through Keepa can revolutionize how you view market trends.
The Middle Chart: Sub-category Best Seller Rank History Chart
The middle chart provides more information about Sales Rank.
It gives information about the sub-categories of Best Seller Rank (BSR / Sales Rank).
The Bottom Chart: Rating History, Review History, and Number of Sellers History
The bottom graph illustrates product reviews, ratings, and the number of sellers over time.
Keepa Pricing

The free version is an unlimited Keepa free trial, which offers access to some of the basic features discussed above.
This makes it an ideal solution for beginners or people who want to explore what this platform can do.
With Keepa’s paid version, you gain access to enhanced functionalities like real-time notifications, tailor-made alerts, the Keepa app, and historical data beyond the past 30 days.
These powerful tools can offer invaluable information and give you a competitive edge.
For more information about pricing, click here.
If you’re wondering how much is Keepa or Keepa price per month is for the paid version?
It’s around $20 a month.
Types of Keepa Versions Available
Keepa has two major versions for its users.
The first is a Keepa extension that can be incorporated into browsers such as the Keepa Chrome extension.
The extension overlays data graphs onto Amazon listing pages and gives quick access and functionality right from your browser.
The second version is the Keepa website, providing an all-encompassing platform for Amazon price and trend tracking.
How to Use Keepa?
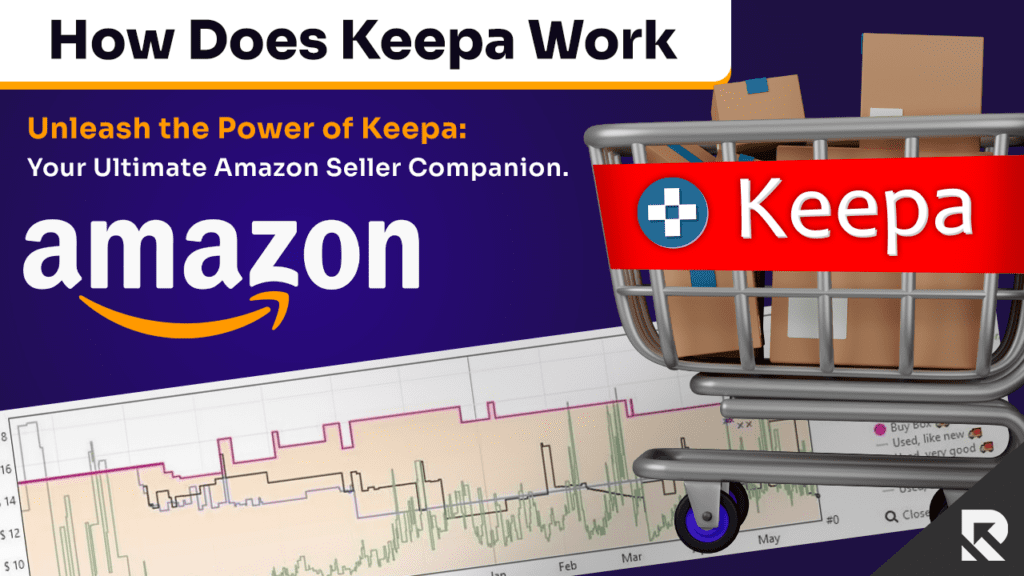
Keepa operates by gathering and processing data from the Amazon marketplace.
It shows the price movements of products over time, which sellers can use to determine trends and make appropriate decisions regarding their inventories.
Keepa makes it easy to retrieve historical pricing data, which is particularly helpful when evaluating whether a product’s current price represents an overvaluation or undervaluation in terms of its average.
What is Keepa Product Finder?
Keepa Product Finder is a great tool to use for reverse sourcing.
This is because it allows you to utilize filters designed particularly for Amazon Sellers.
You can filter by Sales Rank, Amazon in stock status, FBA price and number of sellers or include specific brand names.
It offers Amazon search on steroids.
Interpreting Keepa Charts for Smart Decisions
Now, I will review several cases to demonstrate how to use Keepa and its tools, like the Keepa Chrome extension, in practical scenarios.
Example 1:
In Chart 1 below, you’ll notice the prominent orange-shaded area.
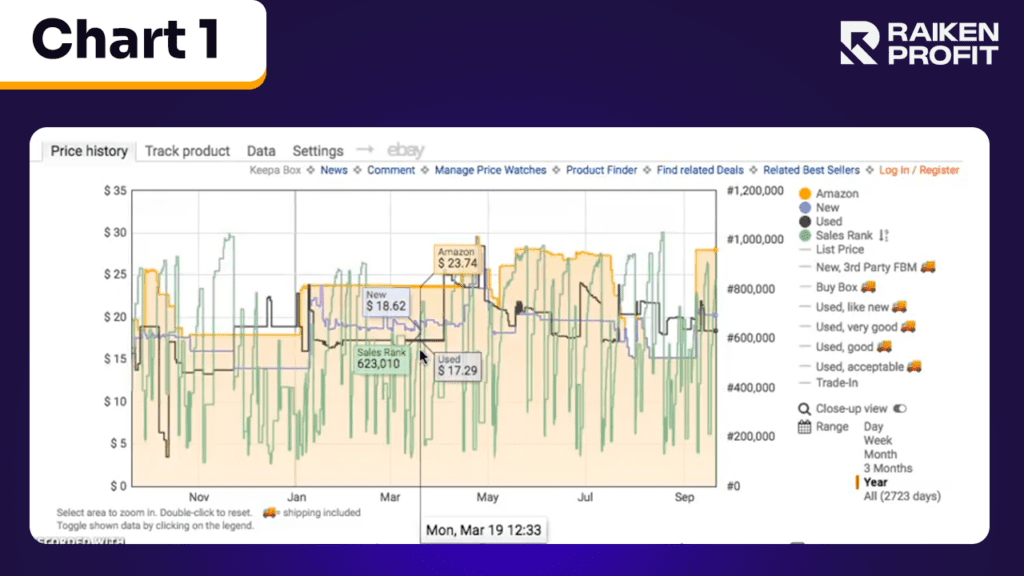
You’ll see this on most items; it represents that Amazon is selling this item, and it is in stock.
The top line bar shows Amazon’s selling price at $23.74.
The blue line going across represents the third-party sellers' price for this item in New condition at $18.62.
The black line going across represents the third-party sellers’ price for this item in Used condition at $17.29.
The green line isn’t shown by default and is only available in the paid version. It represents the Sales Rank or the Best Sales Rank (BSR) of a product.
The jumps in the green line give you a good idea of the historical nature of the product versus when you’re out in the field, scanning a product and seeing a one-time Sales Rank.
The one-time Sales Rank doesn’t give you a full picture of a given item.
Example 2:
Let us now look at the example below. This chart 2 is for a book about pocket watches.
Amazon is pretty much always in stock, so it doesn’t look like a great purchase at first sight.
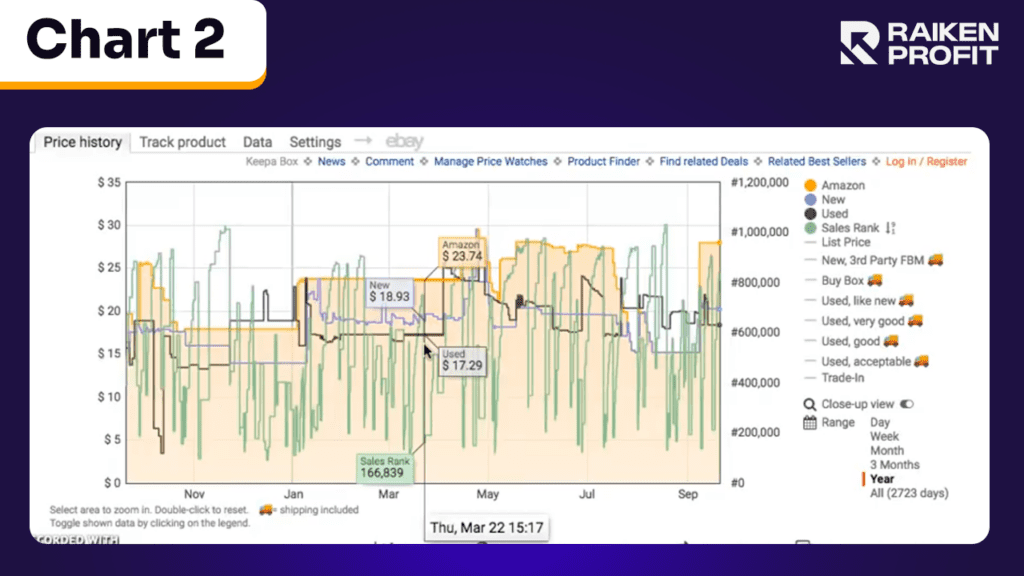
But that is why I’ve chosen this as an example.
When looking at books, generally, a Sales Rank up to 100,000 puts you in the top 1% and 500,000 in the top 5%.
If you’re risk tolerant, then you can look at a Sales Rank above a million.
If you look at the chart below, in the middle of the chart, you’ll see a Sales Rank of 623,000 on March 19.
So, you might say to yourself that it’s not that great since it’s above the 500,000 mark.
But then, if you look at the Sales Rank slightly to the right on March 27, you’ll see that the Sales Rank went down to 166,000.
That is a huge jump and shows why Keepa is so useful.
This is a great example of what appears to be not a great buy, on the face of it, may actually be a great buy when you look at the different Sales Rank figures over a period of time, allowing you to make a completely different business decision.
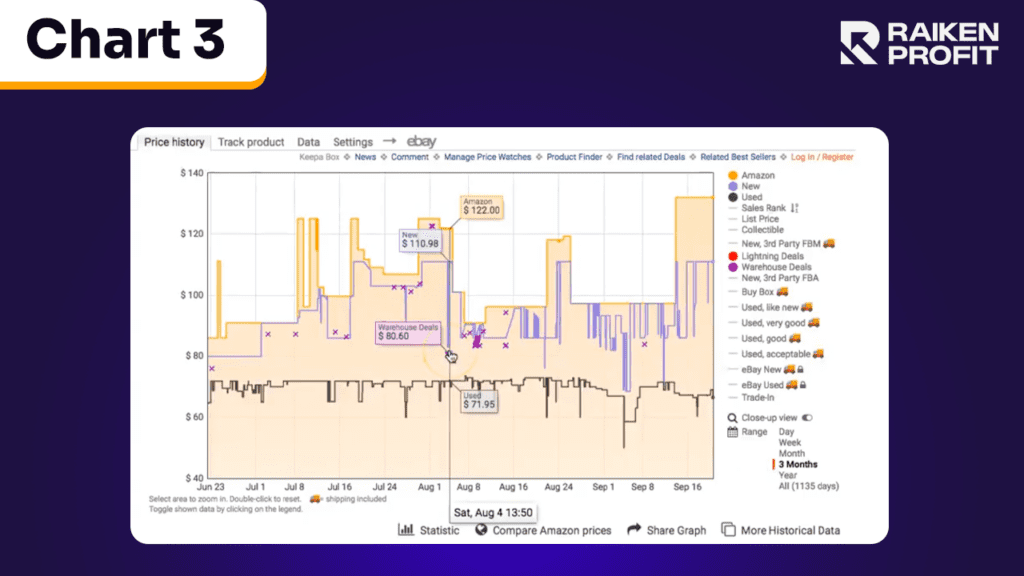
Example 3:
The example below is of a Nursing textbook. It is something Amazon has always had in stock.
There are no gaps in the orange-shaded area, which means that Amazon was never out of stock on this product.
It doesn’t appear to be a good buying decision. Now, let’s say that you found this product as a Used item and wanted to capitalize on that.
What you need to be aware of is the warehouse deals (purple Xs in chart 3 below) that Amazon offers from time to time, and make sure that you price accordingly.
Example 4:
If you click on Statistic, see Chart 4 below; it gives you a good idea of what’s going on in each of the categories. You can see the highest price Amazon had it for was $139 back on March 27, 2016.
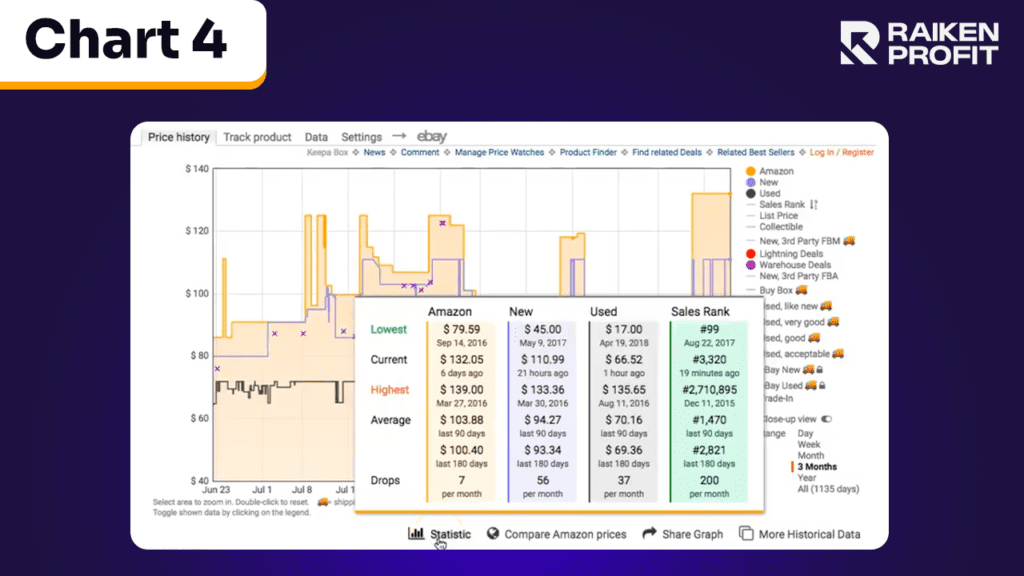
Its average price is around $103 (last 90 days), and its current price is $132.
So, by looking at these statistics for Amazon as well as third-party sellers’ New and Used prices, you can get a good idea of what the market is demanding of a certain item and make decisions accordingly.
Example 5:
This is an example of a Chemistry book. In this example, see Chart 5 below, I want you to notice the Sales Rank.
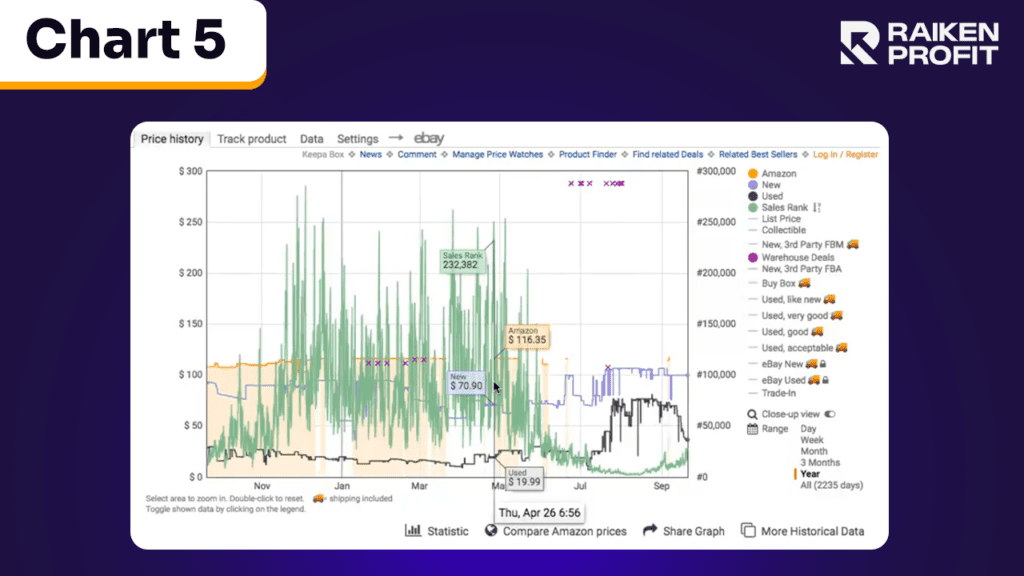
In April or May, at the end of the school year, when Amazon runs out of it from time to time, the Sales Rank jumps up pretty high.
So, if you were looking at this book, out scanning in the field, you might think that it’s not a great Sales Rank, on April 26, the Sales Rank was 232,382, with the New Price being $70 and the Used Price being around $20.
But as you get closer to the new school year, in July and August, you can see the Sales Rank go way down to 2,858; see Chart 6 below.
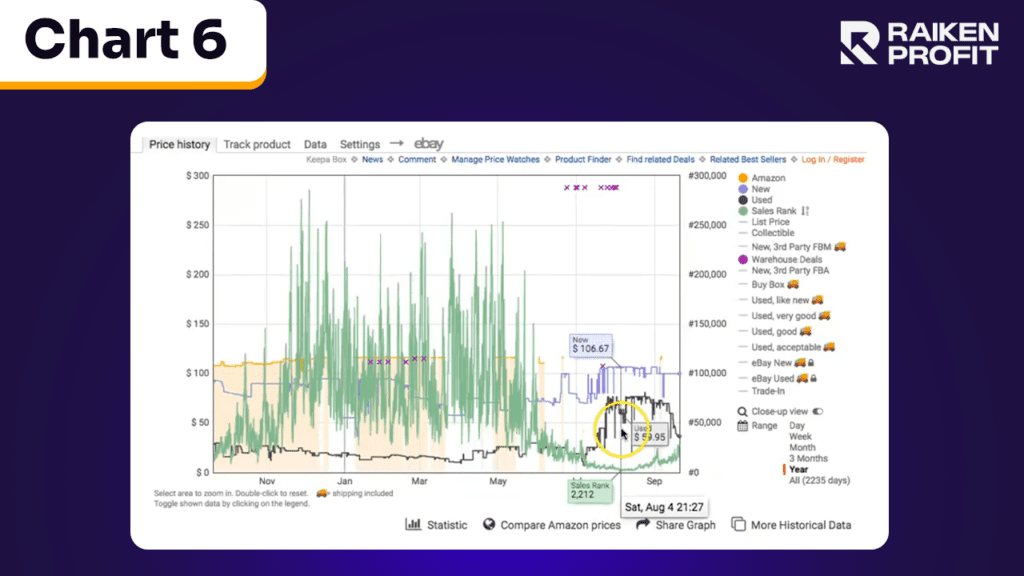
When the Sales Rank goes down, the demand goes up, and the price gets a little bit better.
You can see the New Price was $106, and the Used Price was $73 on July 29.
Back in May, the Used Price was around $18, people were just trying to push them out because it was the end of the school year.
This shows you the power of looking back at the historical data to see where the item is moving and where the demand is.
So, the trend line can be pretty important for some products.
Example 6:
Here's an example with Pie Face, a popular game.
In this case, refer to Chart 7 below to observe how, throughout the year, Amazon's stock impacts the price and Sales Rank.
When Amazon has it in stock, it's priced around $12 and maintains an excellent Sales Rank consistently in the lower hundreds.
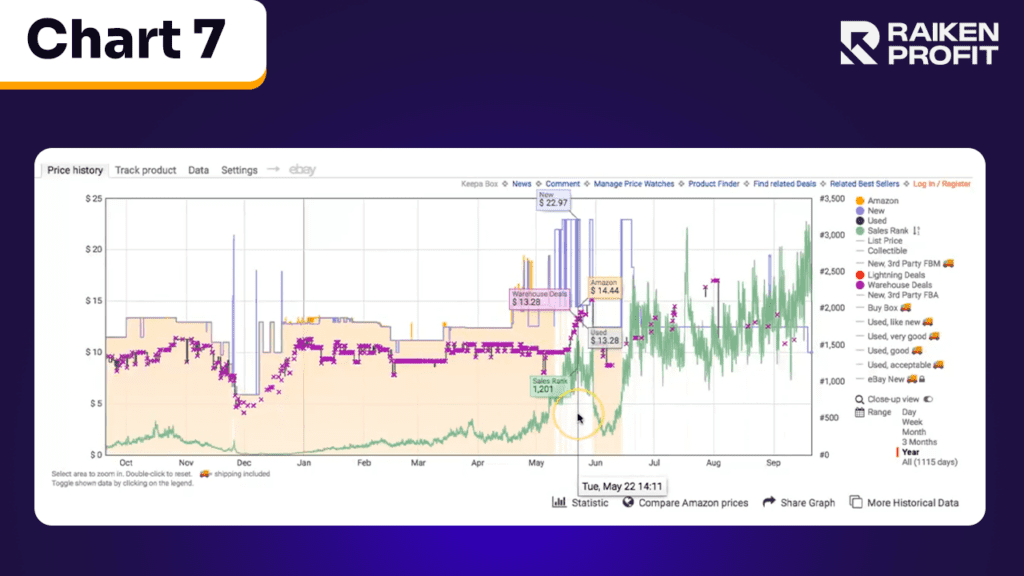
This is where the significance of these charts becomes apparent.
Notice the periods, particularly between May and June, when Amazon runs out of stock (indicated by the white areas in the chart).
During these times, the New Price jumps significantly as third-party sellers seize the opportunity to capitalize on the shortage.
Despite the increased price, the game still enjoys a strong Sales Rank. However, it doesn't move at the same rate as when Amazon is fully stocked.
This example underscores the importance of understanding how supply availability affects both price and demand, as reflected in the Sales Rank.
As we look towards the future, it's crucial to make educated guesses about Amazon's likelihood of restocking a product.
This helps in deciding the depth of investment in a product line. Referring to Chart 8 below, you'll notice that Amazon occasionally runs out of stock but does replenish.
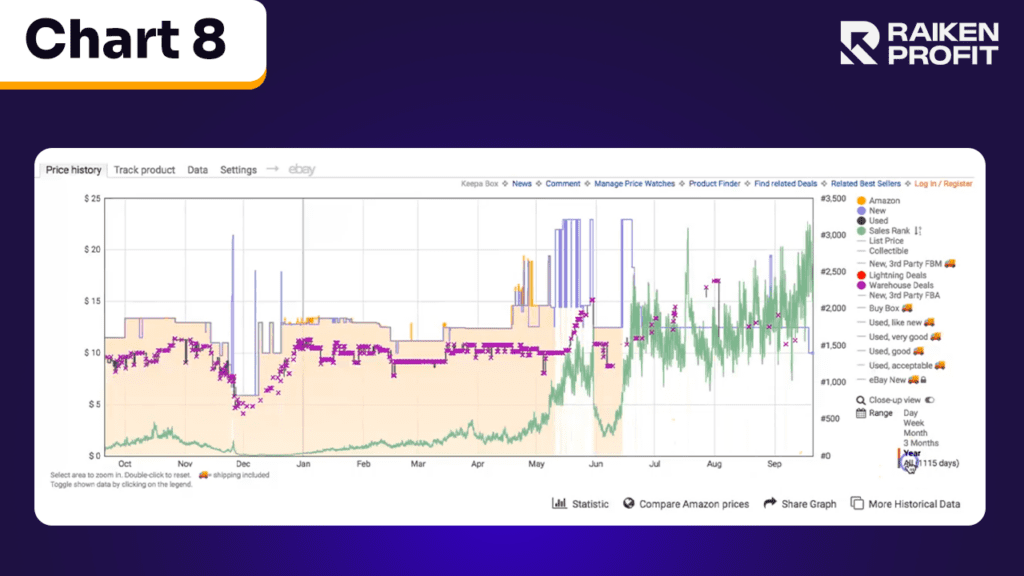
However, examining Chart 7 again, there's a noticeable gap from mid-June onwards. This pattern can inform your buying decisions.
For instance, if you're not restricted from selling a particular Hasbro game and stumble upon a great deal, perhaps a clearance, you can confidently purchase larger quantities.
The data suggests that Amazon may not restock this item soon, which reduces competition.
This is where field experience becomes valuable. When you encounter an opportunity to buy 20 units of an item with a 40% ROI, you must decide whether to clear the shelves or just buy a few.
This decision-making process is where you learn about your risk tolerance.
Making informed choices is key to avoiding situations where you might have to drastically reduce prices later, especially if Amazon re-enters the market and impacts your profit margins.
Example 7:
Here's a compelling example involving a Best Buy video game sale, which you can see in Chart 9 below.
I noticed the game on Best Buy's online sale and checked its status on Amazon.
It turned out that Amazon hadn't stocked this product since January, except for a brief period in April.
Assessing the situation, I concluded that Amazon was unlikely to restock it soon.
So, I seized the opportunity and bought as many as Best Buy allowed, quickly listing them on Amazon.
I managed to sell them for about $40 each, having acquired them for $15, resulting in a substantial profit through Online Arbitrage.
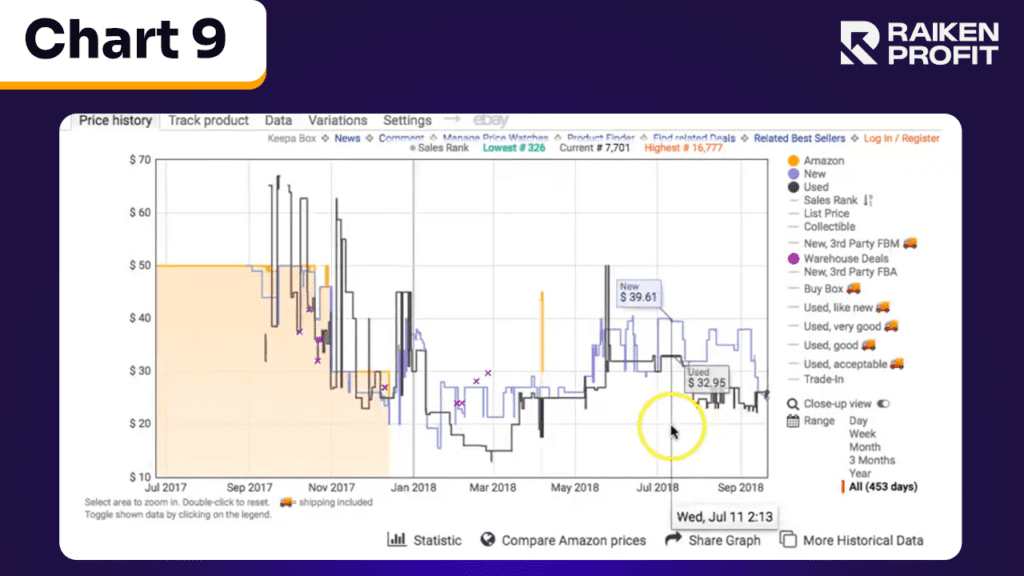
Let's delve into the Sales Rank aspect. Naturally, the Sales Rank is lower when Amazon stocks the item.
However, when Amazon steps out of the picture, the Sales Rank increases.
Despite this increase, there's still a significant profit margin available on the product.
This scenario illustrates how observing stock patterns and Sales Rank fluctuations can lead to profitable buying decisions.
Example 8:
In addition to tracking price history and Sales Rank, Keepa also offers other valuable features, such as deal alerts and browser integration.
You can set up alerts to receive notifications whenever a product you're interested in goes on sale or reaches a desired price point.
This feature can help you stay ahead of the competition and take advantage of lucrative deals before they're gone.
Take, for example, a faucet I was interested in buying. I didn't want to pay the listed price of $256, so I set my target purchase price at $200 in the ‘deal alert.’ Since it wasn't an urgent need, I waited.
On August 23rd, the price dropped to £166, as shown in Chart 10 below.
Keepa sent me an email notification, and I promptly made the purchase.
The following day, the price jumped back up to $238, resulting in an instant saving of around $70.
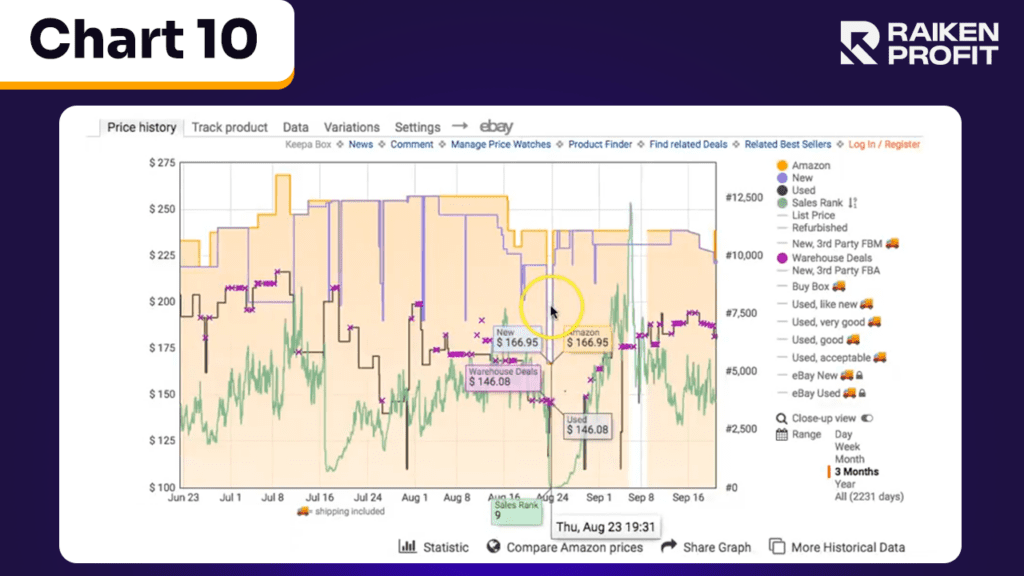
This example also highlights how Sales Rank behaves in relation to pricing changes.
On the day of the deal, the Sales Rank dramatically improved from the thousands to 9.
It gradually increased again as the price returned to its previous level.
This scenario demonstrates the power of using Keepa not just for business decisions but also for personal shopping, enabling significant savings by tracking price changes and making timely purchases.
Example 9:
Keepa is particularly useful when evaluating Amazon Warehouse deals.
By examining the historical pricing chart, you can gain valuable insights. Let's rewind a full year and analyze Amazon's pricing patterns.
For instance, a product was selling at $194 in January, but when Amazon went out of stock and later restocked it, the price surged to $233.
This is evident in Chart 11 below. On May 11, Amazon reduced the price from $233 to $219, which might seem like a good deal at first glance.
However, considering that the item was previously available for $194, this "deal" isn't as attractive as it appears.
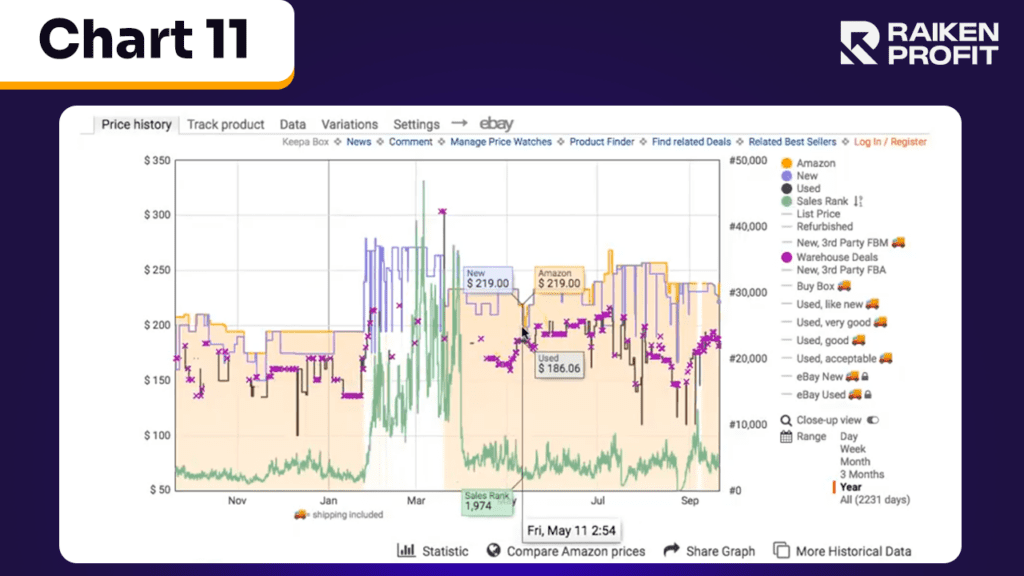
This tool is excellent for distinguishing real bargains from superficial discounts.
It's similar to the tactic used by some retailers, where they inflate prices to offer apparent deals, creating the illusion of significant savings.
Keepa enables you to see through such strategies and understand the true value of the deals being offered.
This tool has been incredibly instrumental in improving my reselling decisions.
It's a classic case of not realizing what you're missing until you have it.
When you're actively reselling in the field, having detailed information readily available is key to making the best choices.
This tool provides exactly that, arming you with the essential data and insights needed for savvy decision-making in the dynamic world of reselling.
So, if you're serious about upping your Amazon game, give Keepa a whirl.
And hey, if you've got questions or need more killer Amazon tips, hit me up on Instagram, TikTok, or Facebook.
I'm here to help you make those sales soar!
Until next time, keep tracking, and happy selling!

Hey, I’m Steve
I'm just an average guy who reached a point in life where I grew weary of the corporate grind and decided to forge my own path.

Welcome to my website where I share my journey as an entrepreneur and offer support to those who aspire to start their own businesses and transform their lives, just like I did.
I understand the challenges and frustrations that come with breaking away from the traditional nine-to-five routine. That's why I created this platform – to provide inspiration, guidance, and practical tips to help you navigate the exciting world of entrepreneurship.


360 Bloomfield Ave, Suite 301,
Windsor, CT, 06095, United States
© Copyright 2026 | All Rights Reserved