When I first started selling on Amazon, tracking my business was simple.
I could look at my bank account, check my sales inside Amazon Seller Central, and get a decent idea of how things were going.
That worked when Amazon was still a small side hustle.
But as the business grew, the numbers became much harder to manage.
I started creating spreadsheets for everything:
- Products I purchased
- Cost of goods
- Refunds
- Amazon fees
- Software expenses
- Payroll
- Virtual assistants
- Prep-center costs
- Overhead
- Reconciliation
Before long, I had spreadsheet after spreadsheet after spreadsheet.
It became an absolute mess.
I have been selling on Amazon for more than 10 years. Over the last five years, I moved heavily into online arbitrage, completed almost 50,000 flips for approximately $5 million in sales, and generated more than $1 million in sales over the last year.
At that level, I could not afford to guess how much money I was making.
I needed to know:
- My real net profit
- My true margins
- Every Amazon fee
- How refunds affected profitability
- How much I was spending on overhead
- Which individual products were actually making money
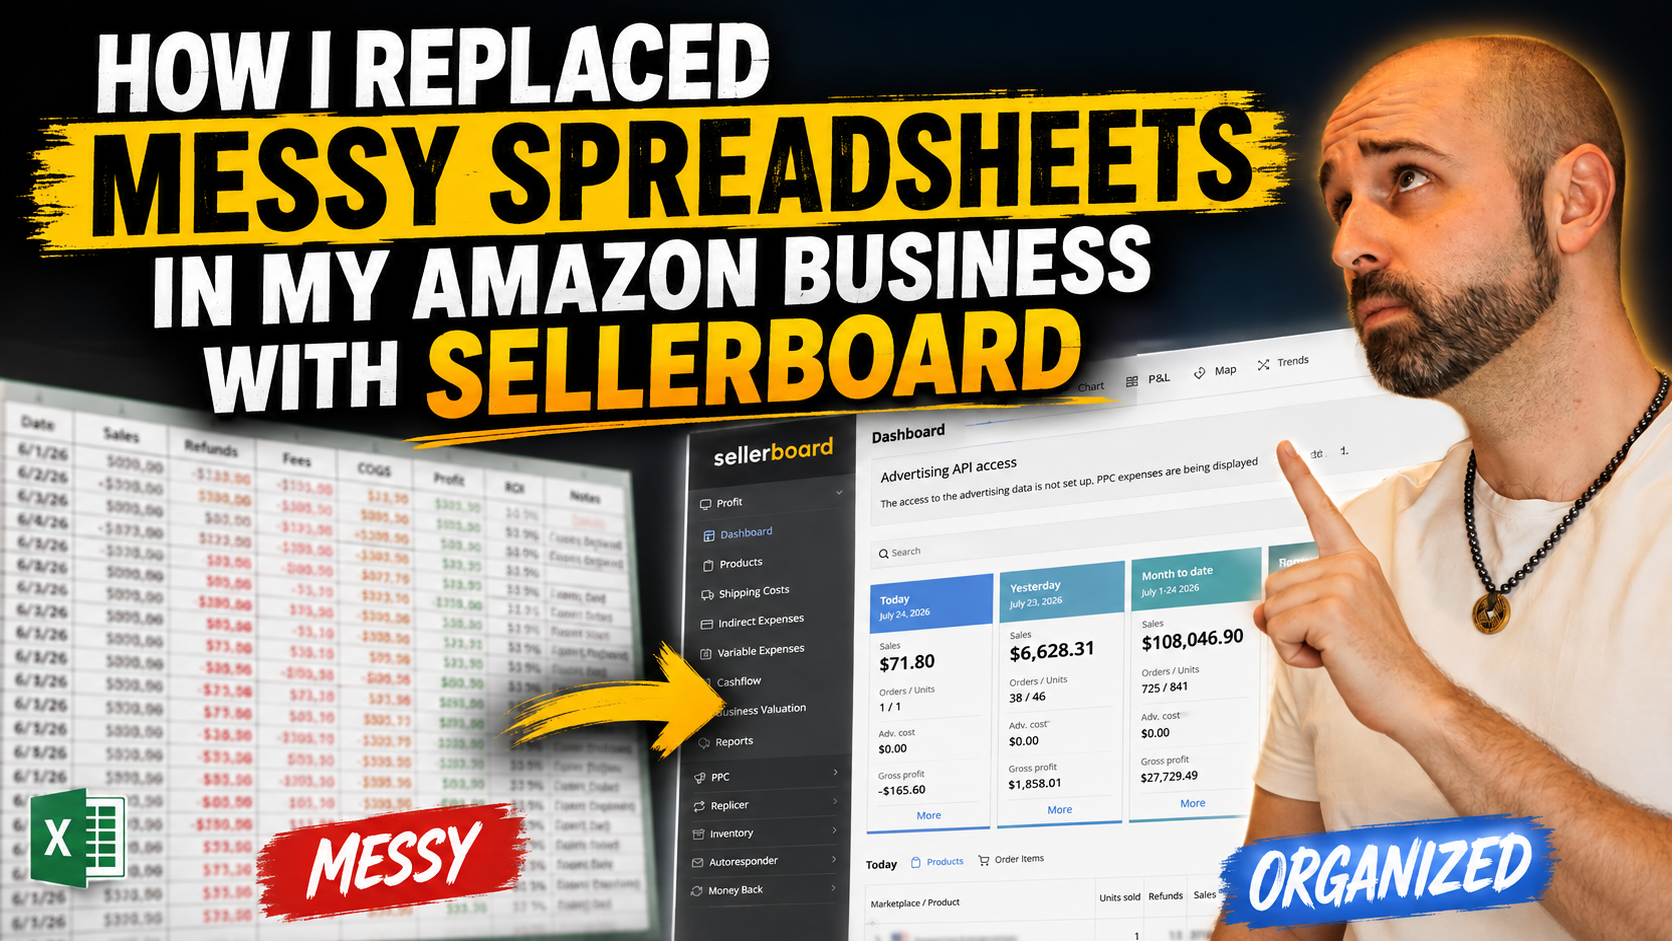
That is why I replaced most of my messy spreadsheets with Sellerboard.
Sellerboard did not build my Amazon business for me.
It did not source products, list inventory, ship orders, or build my team.
What it did was give me something I was missing for years:
Clear visibility into my numbers.
Watch the Full Sellerboard Walkthrough
I recently recorded a full video showing how I use Sellerboard inside my Amazon business.
In the video, I take you inside my actual account and show you how I track:
- Sales
- Orders
- Units sold
- Returns
- Gross profit
- Net profit
- Amazon fees
- Refund costs
- Cost of goods
- Overhead
- Profitability by product
You will be able to see exactly how I use the dashboard and why it replaced so many of the spreadsheets I used to rely on.
Watch the full video below:
(Click Here to Watch on YouTube)
Why Spreadsheets Eventually Stopped Working
Spreadsheets are not bad.
When you are first getting started, they may be all you need.
If you are doing $30,000, $40,000, or $50,000 per year as a side hustle, you may be able to track your business with one or two simple spreadsheets.
But as your Amazon business grows, the amount of information you need to manage grows with it.
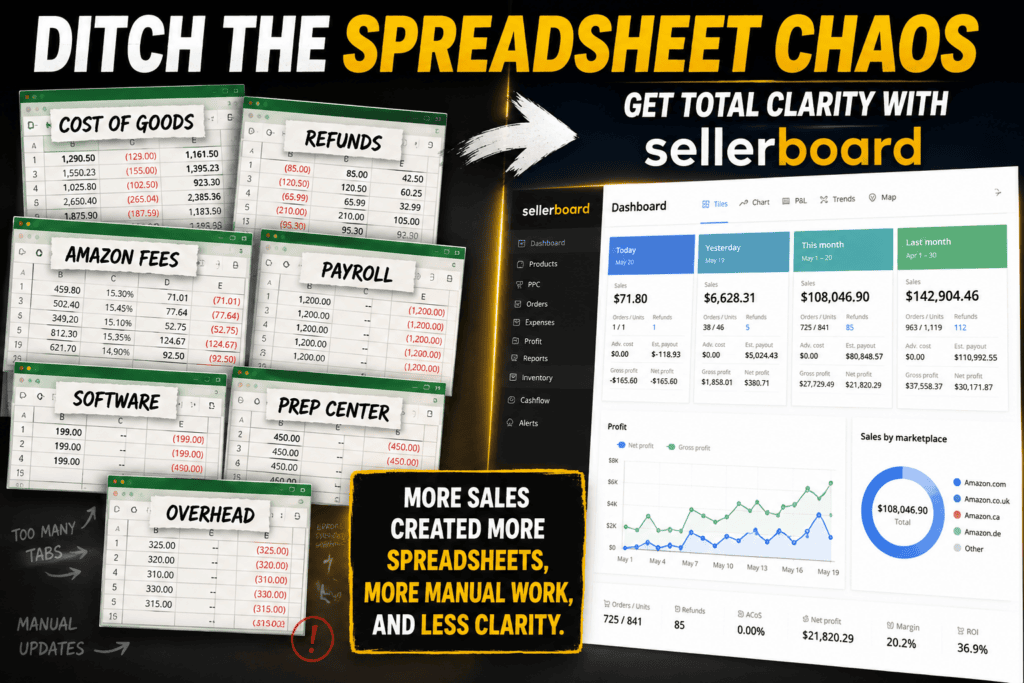
You may need separate systems for:
- Purchases
- Cost of goods
- Inventory
- Refunds
- Returns
- Amazon fees
- Payroll
- Software
- Prep-center expenses
- Shipping
- Bookkeeping
- Taxes
The problem is not that one spreadsheet stops working.
The problem is that you keep adding more spreadsheets until your business information is scattered everywhere.
That creates more manual work.
It also creates more opportunities for mistakes.
One spreadsheet may not be updated.
Another may have the wrong formula.
A team member may enter something in the wrong column.
A refund may never get reconciled.
An Amazon fee may never be included.
At some point, you can have plenty of sales coming in and still not know exactly how much money you are keeping.
That is where I was.
As my business grew from around $50,000 in revenue to $100,000, then $250,000, $500,000, and eventually more than $1 million, it became imperative to understand the numbers without spending hours inside spreadsheets.
Sales growth creates complexity.
You need a better system before the complexity starts controlling the business.
Why Amazon Seller Central Was Not Enough
Amazon Seller Central contains a massive amount of information.
The problem is that the information is spread across different reports, menus, and date ranges.
You can find sales.
You can find refunds.
You can find fees.
You can find returns.
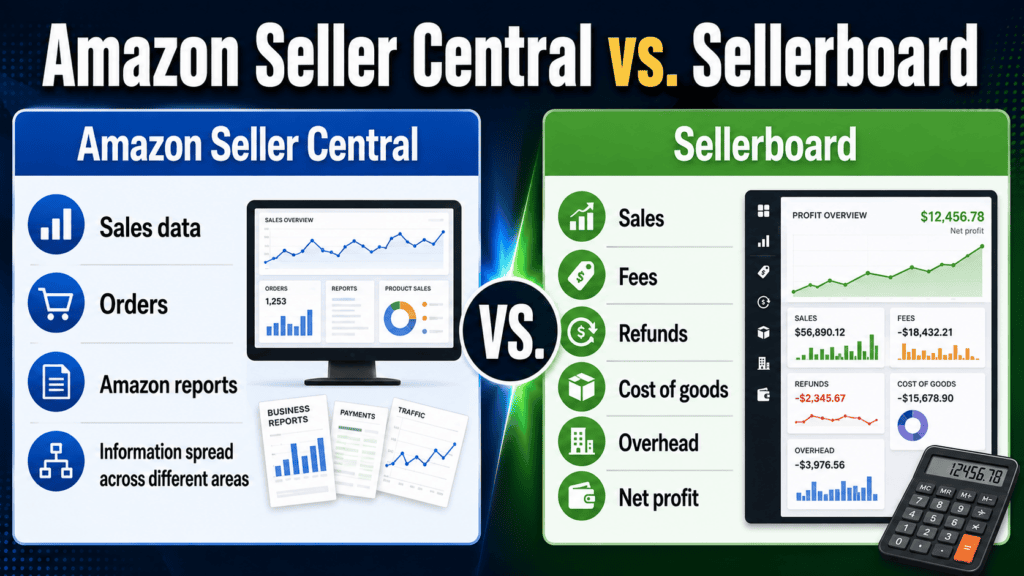
But getting all of that information organized into one accurate net-profit number can be extremely difficult.
Amazon Seller Central also does not know many of the expenses that exist outside Amazon.
It does not automatically know:
- What you paid for your products
- What you spend on software
- What you pay your virtual assistants
- Your prep-center costs
- Your bookkeeping expenses
- Your accounting costs
- Your team payroll
- Other business overhead
Amazon may show you that you generated $100,000 in sales.
That does not mean you made $100,000.
It does not even tell you how much you made after the product cost, Amazon fees, returns, payroll, software, and overhead.
The main question I wanted answered was simple:
How much net profit am I actually making after everything?
That was the question Seller Central and my messy spreadsheets could not answer quickly or confidently.
How Sellerboard Works
Sellerboard connects directly to your Amazon account.
Once you create an account and connect it, Sellerboard begins pulling in your Amazon data.
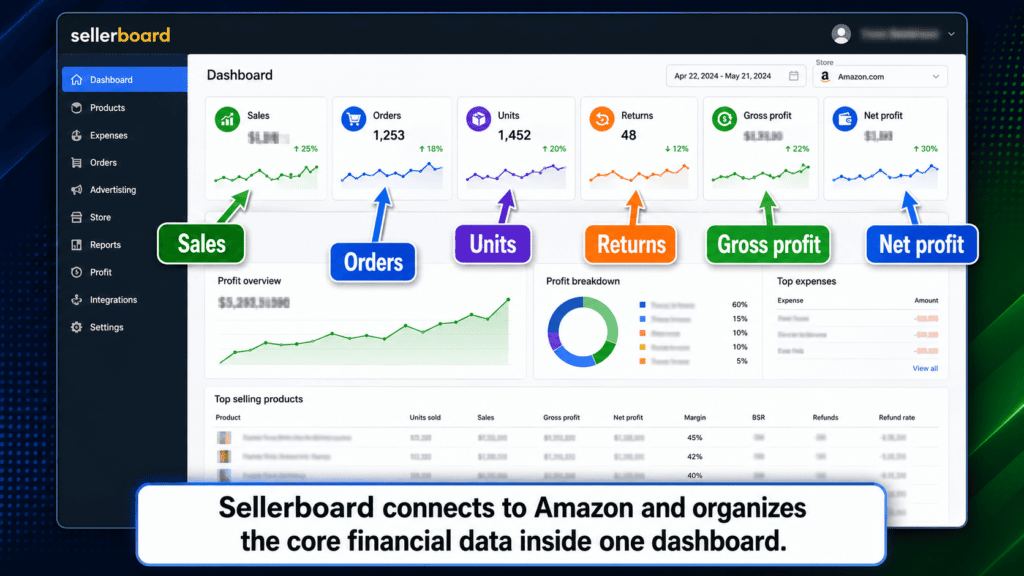
That includes information such as:
- Orders
- Sales
- Units
- Fees
- Refunds
- Returns
- Estimated payouts
The initial data import may take several hours, so I would give it up to 24 hours to fully populate.
After that initial setup, the system continues pulling in updated Amazon information automatically.
You will still need to add information Amazon does not know, especially:
- Cost of goods
- Indirect expenses
- Overhead
Once those pieces are added, Sellerboard can give you a much clearer picture of your actual profitability.
That is where the software becomes so valuable.
It takes information that used to live across Amazon reports and multiple spreadsheets and brings it into one dashboard.
The Dashboard Gives Me a Clearer View of Profitability
One of the main ways I use Sellerboard is by reviewing the dashboard.
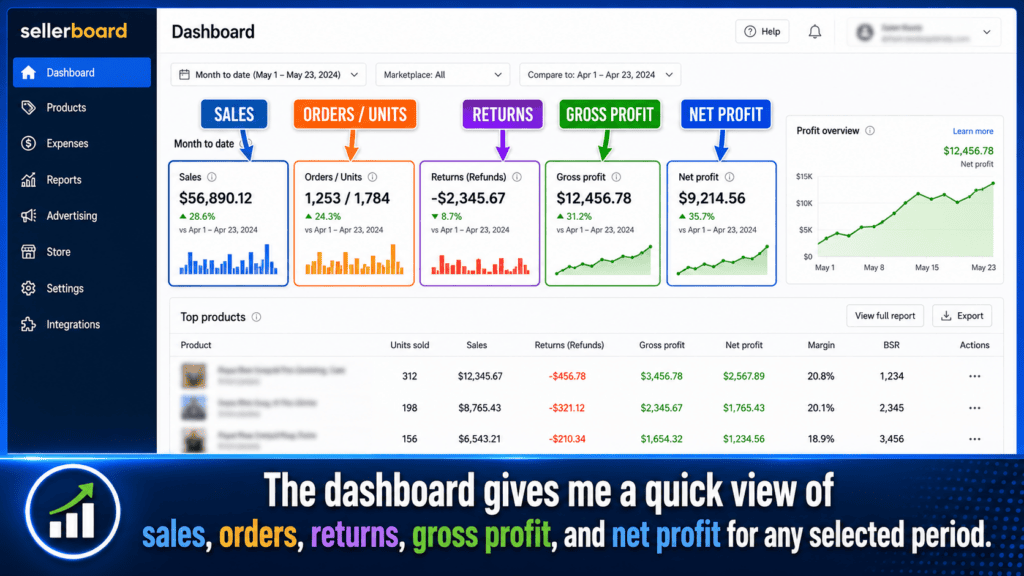
I can change the date range and look at:
- Today
- Yesterday
- Month to date
- Last month
- Two months ago
- Three months ago
- A completely custom date range
This helps me answer basic but important questions quickly.
How much did I sell?
How many orders came in?
How many units did I sell?
How many returns did I have?
What was my gross profit?
What was my net profit?
In one example from the video, the dashboard showed approximately:
- $108,000 in month-to-date sales
- 725 orders
- 841 units
- 85 returns
- Almost $28,000 in gross profit
- Nearly $22,000 in net profit
The exact numbers are less important than the visibility.
I can see the information without opening five reports and updating three spreadsheets.
That saves time and gives me much more confidence in the numbers.
Sellerboard Breaks Down Amazon Fees
Amazon fees can become extremely difficult to track manually.
A single transaction can include multiple fees, especially when you sell through FBA.
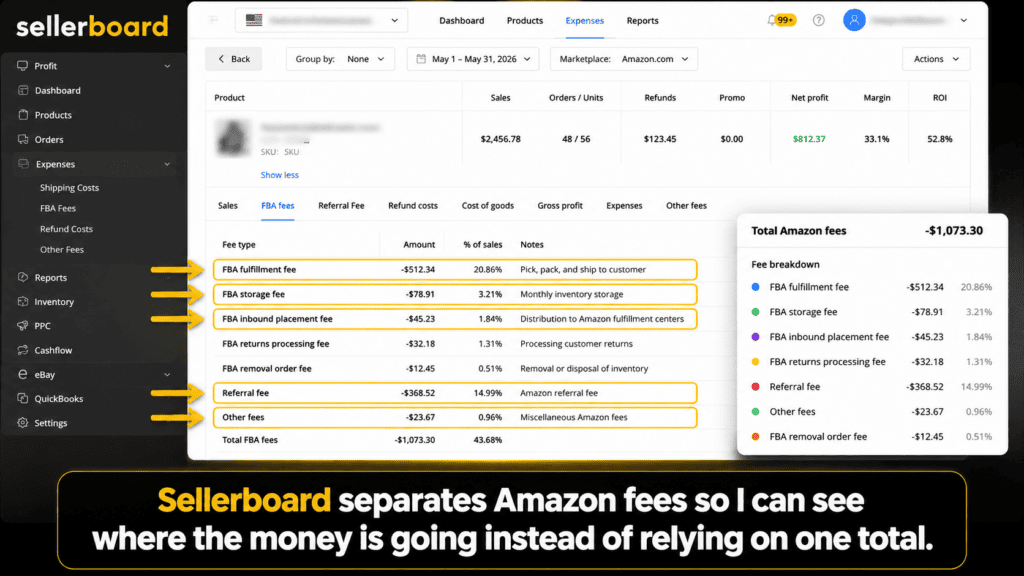
Inside Sellerboard, I can see a much more detailed breakdown of fees, including items such as:
- Referral fees
- FBA fees
- Inbound fees
- Variable closing fees
- Shipping-related fees
- Transportation costs
- Subscription fees
- Other Amazon charges
This is one of the areas where spreadsheets became overwhelming for me.
I could create a spreadsheet to track fees, but I still had to find the information, organize it, and make sure every number was updated correctly.
Sellerboard organizes those charges inside the profitability breakdown.
Instead of seeing one vague fee total, I can see where the money is actually going.
That matters because small fees add up quickly across hundreds or thousands of transactions.
Refunds Become Much Easier to Understand
Refunds are another area that can destroy profitability if you are not tracking them correctly.
A refund is not always as simple as giving the customer their money back.
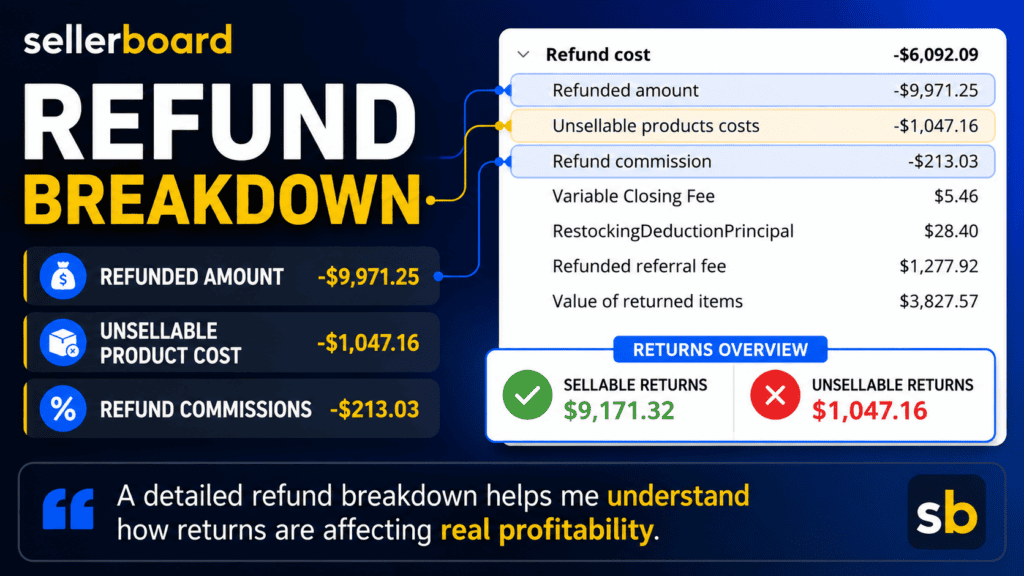
There can be additional effects, including:
- Refunded amounts
- Unsellable product cost
- Refund commissions
- Variable closing fees
- Restocking deductions
- The value of returned inventory
- Whether the return came back sellable or unsellable
Sellerboard lets me see a detailed refund breakdown.
I can also see what percentage of returns were sellable and which ones were unsellable.
That information matters because two products with the same sales can have very different profitability if one has a much higher refund rate.
Revenue can look strong while refunds quietly destroy the profit.
The more products you sell, the more important this becomes.
Cost of Goods Is Essential for Accurate Net Profit
Amazon knows what the customer paid.
It does not automatically know what you paid for the product.
That is why cost of goods is so important.
Without accurate product costs, your net-profit number will not be accurate.
Inside Sellerboard, you can enter the cost of goods for each item.
In my business, my team updates this information regularly.
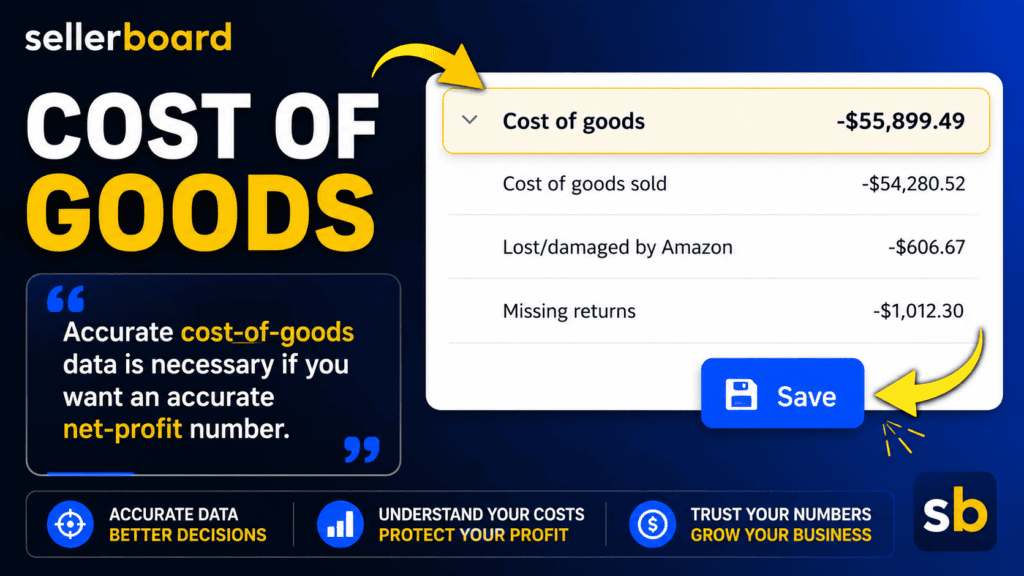
The process is simple:
- Find the product inside the inventory area.
- Enter the amount paid for the item.
- Save the cost.
- Sellerboard uses that cost when calculating profitability.
The more accurate your cost data is, the more useful the dashboard becomes.
I recommend having a consistent system for tracking buy cost.
One option is to include the buy cost inside your custom SKU.
Another option is to maintain a separate purchase record that your team can use when updating Sellerboard.
If your historical data is incomplete, you can choose a clean starting date and begin tracking accurately from that point forward.
For example, you may decide that beginning on the first day of a new month, every product cost and expense will be entered correctly.
Perfect historical data is helpful, but a clean system moving forward is more important than waiting forever to get started.
Tracking Overhead Changed the Way I Viewed My Business
Cost of goods is only one part of the equation.
You also need to account for the expenses Amazon does not know about.
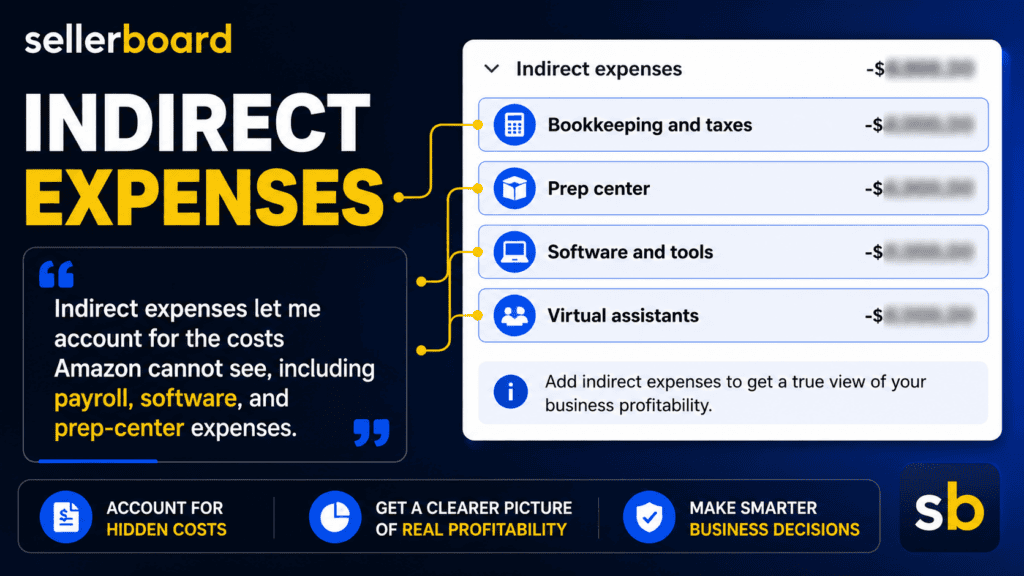
Inside Sellerboard, I can add indirect expenses such as:
- Virtual assistants
- Prep-center costs
- Software
- Tools
- Bookkeeping
- Taxes
- Accounting
- Legal expenses
- Other business overhead
These expenses can be added as one-time or recurring costs.
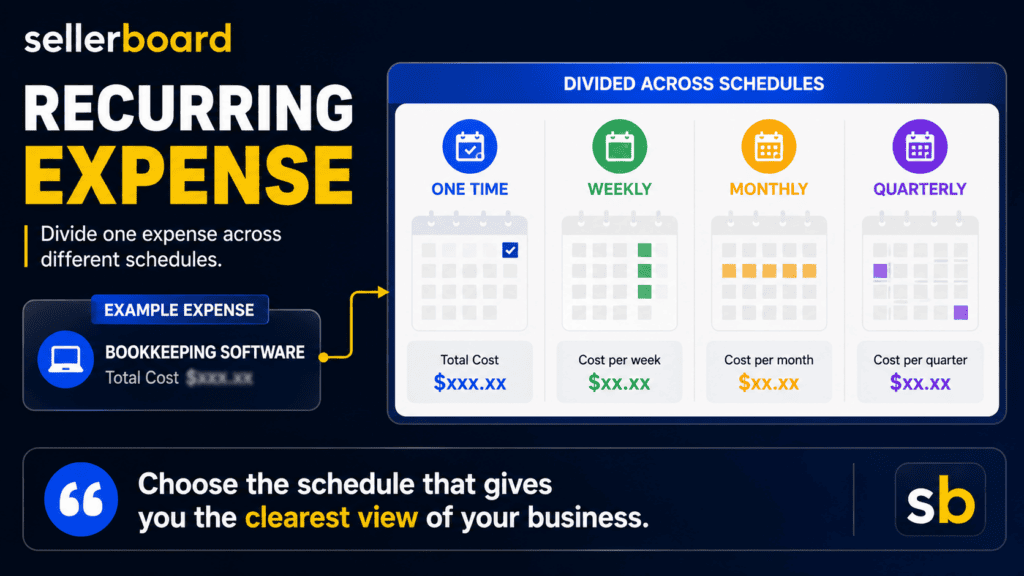
Depending on the expense, you may set it to occur:
- Daily
- Weekly
- Monthly
- Quarterly
- One time
In my business, I often spread certain overhead expenses across seven-day periods.
That helps make the dashboard more useful on a daily and weekly basis.
For example, instead of having an entire month of overhead hit on one single day, I can divide it into weekly amounts.
That does not change the total expense.
It simply helps me see a more realistic profitability picture throughout the month.
This is one of the major differences between revenue and true profit.
You may be doing thousands of dollars per day in sales, but you still have payroll, software, prep fees, and other overhead coming out of the business.
The Biggest Feature for Me: Profitability by Product
Seeing total business profit is important.
But one of the biggest advantages of Sellerboard is being able to analyze profitability at the individual-product level.
This is critical for online arbitrage.
You may look at a product and see that you have sold it several times before.
That does not automatically mean you should buy it again.
The real question is:
Did that product actually make money after refunds, fees, expenses, and cost of goods?
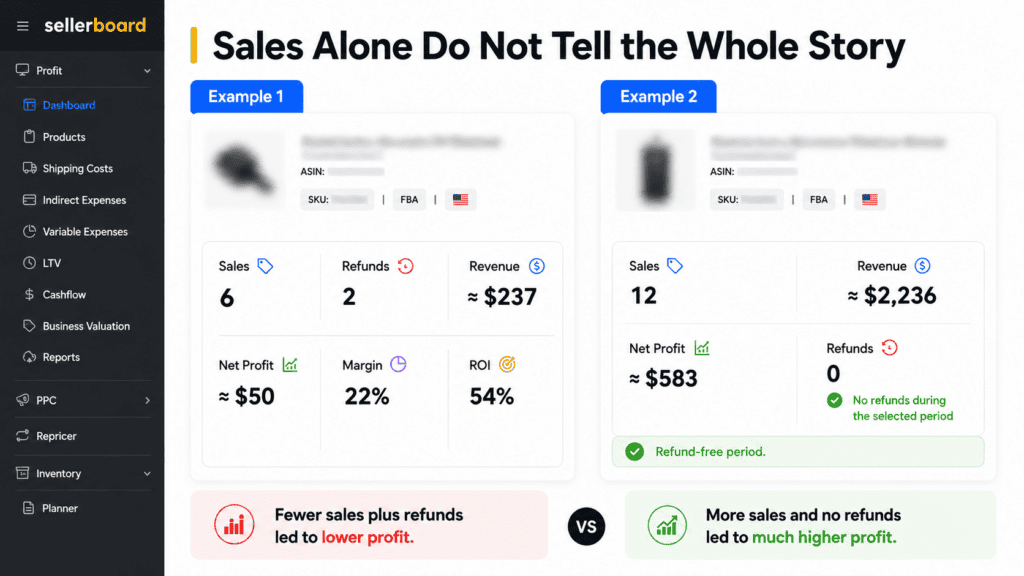
In one example from the video, I looked at a product that had sold six times.
The total Amazon revenue was approximately $237.
But after two refunds, Amazon fees, product costs, and other expenses, the actual net profit was only around $50.
The actual margin was approximately 22%, and the actual ROI was around 54%.
Without Sellerboard, someone might only see that the product sold multiple times and assume it was a great replenishable item.
Sellerboard showed the actual result.
In another example, I reviewed a product that sold 12 times.
It generated approximately $2,236 in sales and produced around $583 in net profit after expenses, with no refunds during the selected period.
That is the information I need when deciding whether to buy a product again.
Sales history tells me that a product moved. Profitability tells me whether it was worth selling.
Custom Date Ranges Help Me Review Specific Periods
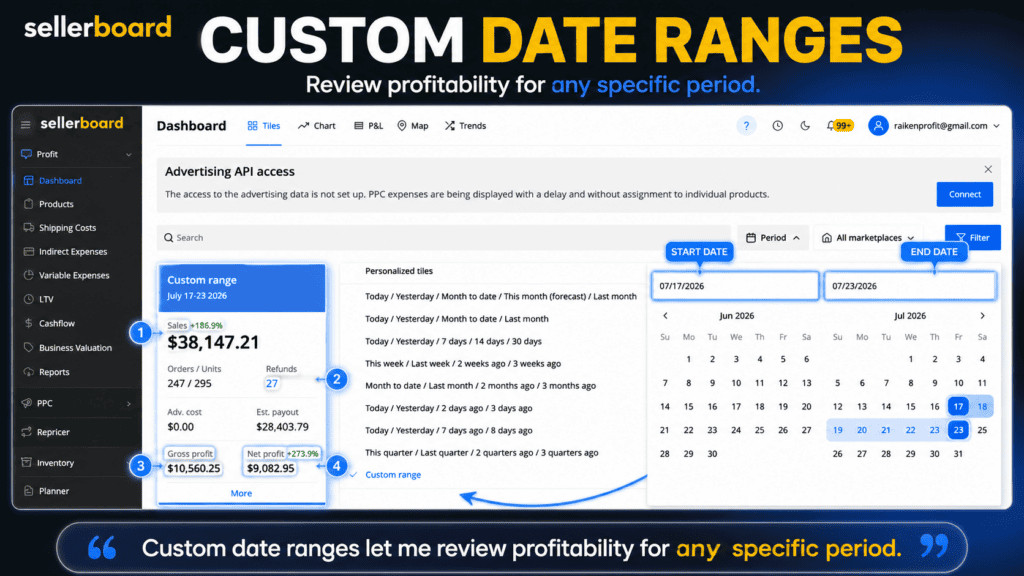
Sellerboard also allows me to review profitability across a custom date range.
That means I am not limited to today, yesterday, or the current month.
I can choose a specific beginning and ending date and review what happened during that period.
For example, I may want to see:
- How much profit I made last week
- How a specific month performed
- What happened during a promotion
- How profitability changed after adding a new expense
- Whether a product remained profitable during a certain period
In one example, I selected a seven-day range and could see:
- Approximately $38,000 in sales
- 27 refunds
- Around $28,000 in estimated Amazon payouts
- Approximately $10,500 in gross profit
- Around $9,000 in net profit
That makes it much easier to review the business in meaningful time periods instead of looking at disconnected daily numbers.
Sellerboard Gives Me Confidence in My Numbers
Sellerboard did not create my sales.
I still had to learn how to source products.
I still had to list and ship inventory.
I still had to build systems and train a team.
But Sellerboard gave me visibility into what was happening after the sales came in.
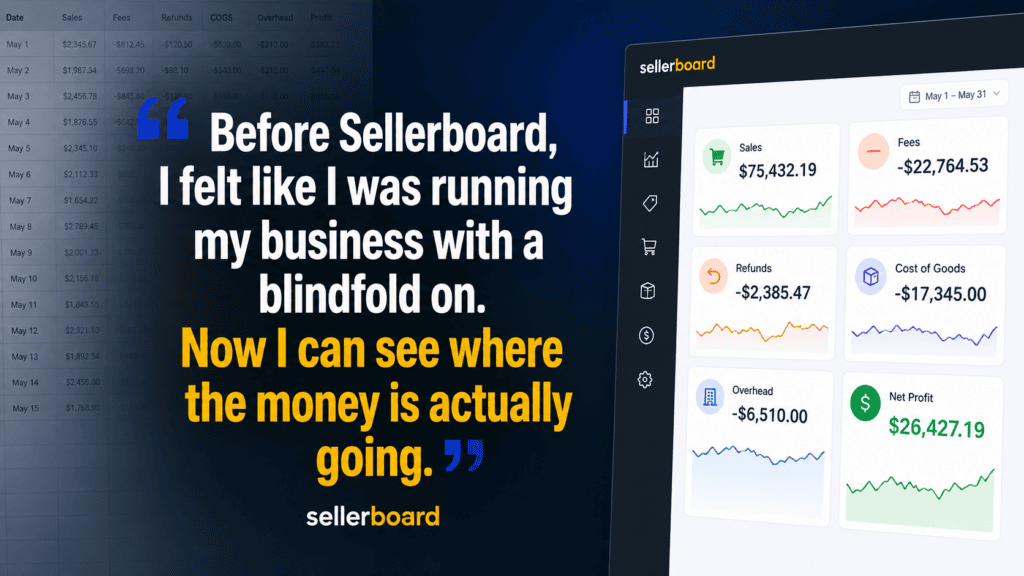
Before, I felt like I was running the business with a blindfold on.
I had sales.
I had inventory moving.
I had money going in and out.
But I could not always see clearly through all the Amazon reports, refunds, fees, expenses, and spreadsheets.
Now I can see:
- Sales
- Amazon fees
- Refunds
- Cost of goods
- Overhead
- Gross profit
- Net profit
- Profitability by product
- Results across custom date ranges
The biggest benefit is confidence.
I am no longer wondering where the money went.
I can look at the numbers and make better decisions based on what actually happened.
That does not mean every number will always be perfect without effort.
You still need to update product costs.
You still need to add overhead.
You still need to maintain good systems.
But once the information is inside Sellerboard, the business becomes much easier to understand.
What Sellerboard Replaced in My Business
Sellerboard did not eliminate every spreadsheet I use.
There are still situations where a spreadsheet makes sense.
But it replaced a large amount of manual financial tracking.
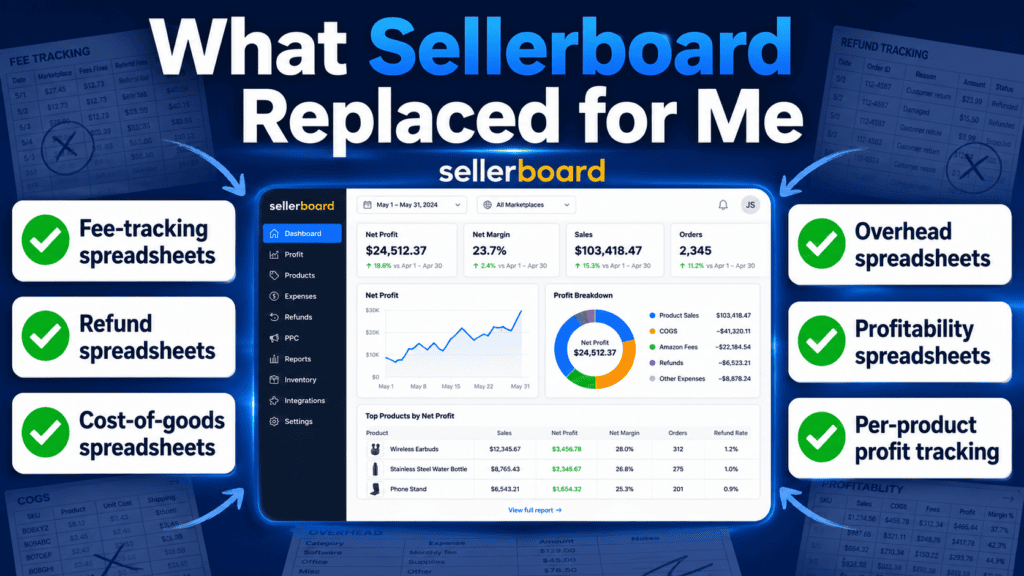
Instead of relying on separate spreadsheets for:
- Amazon fees
- Refunds
- Cost of goods
- Overhead
- Monthly profitability
- Product profitability
I can review most of that inside one system.
That reduces duplicate work.
It also makes it easier for my team to maintain the information.
A spreadsheet is useful when it has a specific purpose.
The problem starts when your business depends on dozens of disconnected spreadsheets that must all be updated manually.
Sellerboard helped me simplify that process.
What You Need to Do After Signing Up
Sellerboard automatically pulls a large amount of Amazon data, but you still need to complete the setup properly.
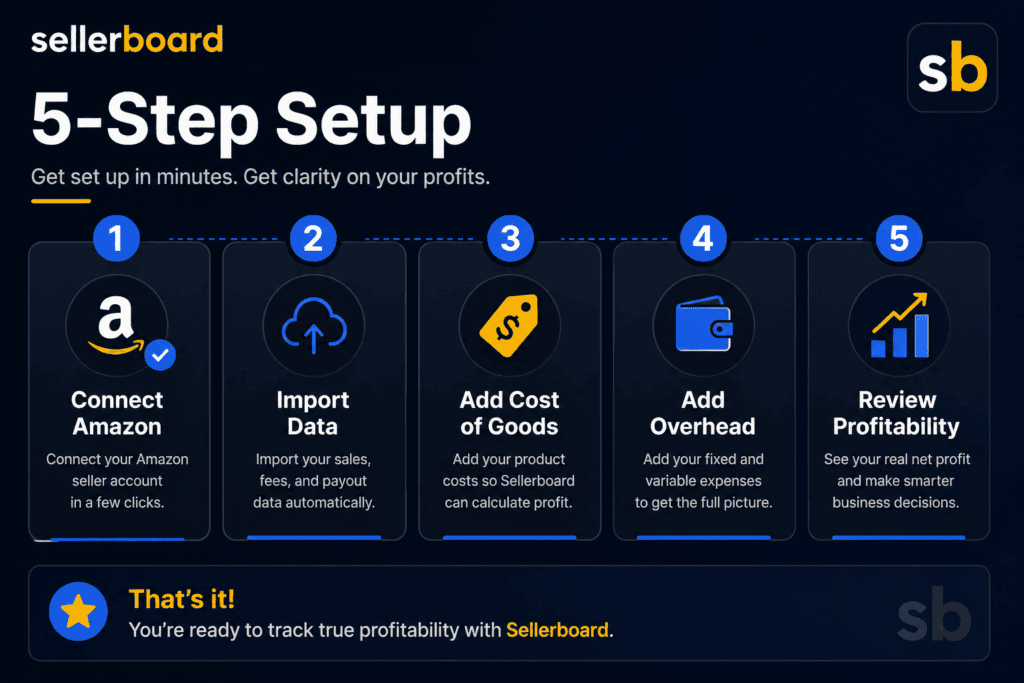
Your first priorities should be:
1. Connect Your Amazon Account
Allow Sellerboard time to import the data.
The first import may take several hours.
2. Add Your Cost of Goods
Make sure Sellerboard knows what you paid for each product.
Without that information, your profitability will not be accurate.
3. Add Your Overhead
Enter expenses such as:
- Software
- Prep center
- Virtual assistants
- Bookkeeping
- Accounting
- Payroll
- Other business costs
4. Choose a Consistent Updating Process
Decide who will update product costs and expenses.
In my business, my team handles much of this work.
5. Pick a Clean Starting Point
If your historical records are incomplete, choose a date and begin tracking accurately from that point forward.
The software becomes more valuable as the information you enter becomes more accurate.
Try Sellerboard Free for 60 Days
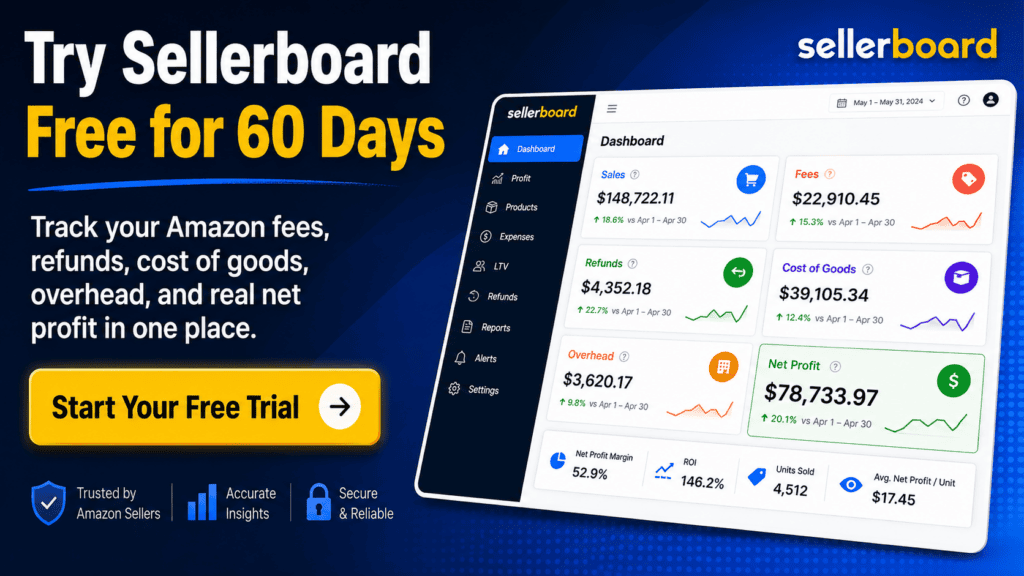
You can test Sellerboard inside your own Amazon business with an extended 60-day free trial through my link.
Start Your Free 60-Day Sellerboard Trial
Sellerboard normally offers a 30-day trial, but my link extends that trial to 60 days.
SELLERBOARD FAQ
Frequently Asked Questions
Quick answers about Sellerboard, profitability tracking, expenses, product costs, and reporting.
Not necessarily.
You may still use spreadsheets for specialized workflows, purchasing systems, or team processes.
Sellerboard can replace many of the spreadsheets used to track Amazon profitability, fees, refunds, overhead, and product performance.
No.
You need to enter or import your product costs.
Sellerboard cannot accurately calculate net profit without knowing what you paid for the inventory.
Yes.
Indirect expenses can include virtual assistants, payroll, prep-center costs, software, bookkeeping, accounting, and other overhead.
Yes.
Expenses can be configured based on different schedules, including weekly, monthly, quarterly, or one time.
Yes.
You can search for an ASIN and review the sales, refunds, fees, product costs, net profit, margin, and ROI for that product over a selected period.
Yes.
You can choose a specific start and end date to review sales and profitability during that period.
No software can make a bad product or poor business model profitable by itself.
Sellerboard helps you understand the numbers so you can make better decisions.
The initial connection may take several hours.
I recommend allowing up to 24 hours for the first import to populate.
My link provides an extended 60-day free trial of Sellerboard.
Final Thoughts
As your Amazon business grows, tracking the numbers becomes more important and more complicated.
What works at $50,000 per year may not work at $500,000 or $1 million.
At some point, you need more than a bank balance, a Seller Central sales report, and a pile of spreadsheets.
You need to know:
- What you sold
- What Amazon charged
- What was refunded
- What the inventory cost
- What you spent on overhead
- How much net profit remained
- Which products were actually worth selling
That is what Sellerboard helps me see.
It gives me a clearer view of my business in one place.
It helps me understand my total profitability.
It also lets me go deeper and measure the real results of individual products.
That visibility has given me more confidence to make decisions, reinvest money, and continue growing the business.
Watch the Full Sellerboard Video
How Sellerboard Replaced Messy Spreadsheets in My 7-Figure Amazon Business
Get an Extended 60-Day Free Trial

Hey, I’m Steve
I'm just an average guy who reached a point in life where I grew weary of the corporate grind and decided to forge my own path.

Welcome to my website where I share my journey as an entrepreneur and offer support to those who aspire to start their own businesses and transform their lives, just like I did.
I understand the challenges and frustrations that come with breaking away from the traditional nine-to-five routine. That's why I created this platform – to provide inspiration, guidance, and practical tips to help you navigate the exciting world of entrepreneurship.







360 Bloomfield Ave, Suite 301,
Windsor, CT, 06095, United States
© Copyright 2026 | All Rights Reserved